DORA (DevOps Research and Assessment) metrics are an excellent way for engineering organisations to measure and improve their performance.
Up until now, monitoring the DORA metrics across Github, Jira, Azure Devops etc required custom tooling or a tedious manual process.
With Apache Dev Lake you can get beautiful reporting for DORA metrics on your local machine in as little as 15 minutes (honestly!).
DORA Metrics
DORA metrics are 4 dimensions for improving your engineering team. The metrics came out of a report by Google in 2020. They’re designed so they balance velocity and stability.
- Deployment Frequency
- Lead time for changes
- Median Time to Restore Service
- Change Failure Rate
These metrics are explained in detail in books (here) and blogs (here) so I won’t go in to any detail on what they are here.
I have a note at the end of this article on updates to DORA since 2020 and the newer Microsoft SPACE framework.
The old way of tracking DORA metrics
Most teams will have various support systems like Github, Azure DevOps, Jira etc.
Extracting the metrics required for DORA across so many developer tools is difficult to automate without custom software. The time cost is too much, especially for small teams.
When I first started tracking DORA I used a spreadsheet and did everything manually.
It wasn’t pretty and it was a lot of work but I was able to see a noticeable increase in deployed work when deployment frequency increased.

Custom spreadsheet of DORA metrics
Tracking DORA metrics in 2022: Apache Dev Lake
Apache Dev Lake is a project from the Apache Foundation specifically for tracking engineering performance metrics.
The project is new and it is in the incubation stage at the Apache Foundation.
Dev Lake is a set of services in containers - a database, a data pipeline, a grafana instance with pre-built reports and a configuration web application.
The dev lake team provide helm charts and docker compose files for easy setup of the infrastructure.
The benefits of tracking your DORA metrics in Dev Lake are:
- It connects to most major platforms out of the box (Jira, Github, DevOps)
- Comes with pre built Grafana charts for DORA and many other metrics
- Free and you can easily run it locally to get started
- Your data or your client’s data never leaves your organisation
Having the data processed and stored locally is a huge benefit for many organisations. It means you don’t have to add an additional supplier to get started with DORA metrics.
Visit the dev lake site for more details.
Setting up a local instance of Apache Dev Lake
You should have docker desktop installed before continuing.
- Get the docker compose and .env files from the releases page - https://github.com/apache/incubator-devlake/releases/latest and place them in a folder
- Open a terminal in that folder and
mv .env.example .env docker compose up- That’s it! Wait for the 4 services to start
- You should be able to access the configuration site at https://localhost:4000
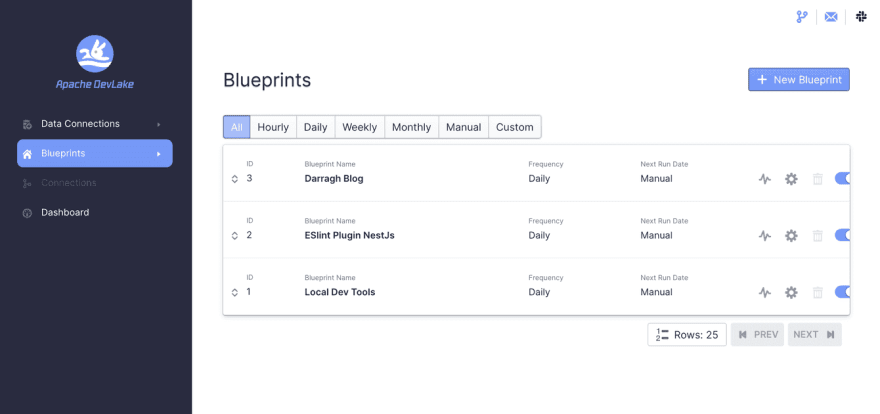
There are some sites already configured on the instance in the image above. Yours will be empty for now.
Now you can add any connections to your engineering tools like Jira or Github.
Adding connections to common dev tools
Github is very popular so let’s use that to demonstrate setting up a tool connection.
- Click on Data Connections > Github
- Give the connection a name you’ll remember
- The endpoint is
https://api.github.com/unless you have a special enterprise account - then you’ll need to use your own endpoint - Get a personal access token from Github and paste it in the token field (https://github.com/settings/tokens)
The PAT permissions you need are:
repo:statusrepo_deploymentpublic_reporepo:inviteread:userread:org
I set the github rate limit to 5000 requests per hour but you can leave that as default if you like.
Configuring projects in Dev Lake
Now that you have a connection to your dev tools you can configure projects. In Dev Lake a project is called a “Blueprint”.
I’ll add one of my open source projects (https://github.com/darraghoriordan/eslint-plugin-nestjs-typed) to show how it works.
- Click on Blueprints > Add Blueprint in the main left-hand menu
- Give it a name and select the Github connection you created earlier

Add blueprint screen - summary
- Click next and enter the name of the repo(s) associated with your project

Add blueprint screen - repository
- Click next and on the summary screen click on the “add transformation” link. You have to tell Dev Lake how to identify deploys and incidents for your setup.

Add blueprint screen - optional transformation
- On the add transformation screen you have to configure the tag you use on a Github issue that identifies an incident and the Github actions
Jobthat identifies a deploy.

Add blueprint screen - adding transformation
For the deployment section make sure that you’re getting the Job name and not the workflow name.
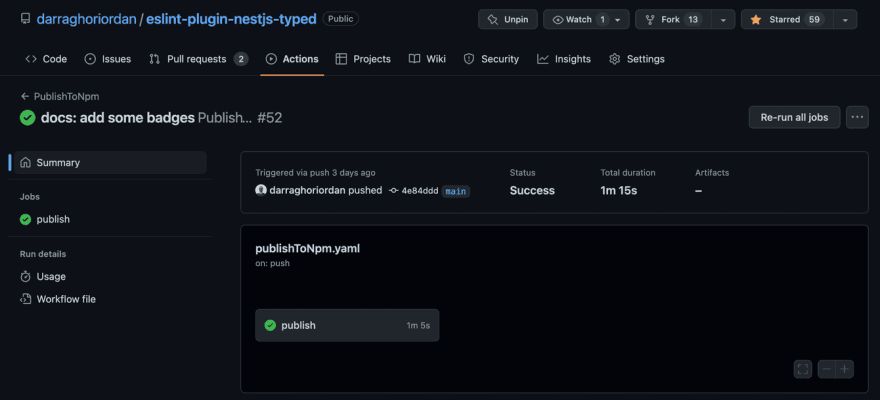
To get the job name on Github, click into an old run of your workflow and you’ll see the job name on the left hand side.

Github actions settings for transformation
- Click on “save and run now” and you should be done configuring Dev Lake. Wait for the blueprint data collection run to complete.
You can open the Blueprints page anytime and click on the graph “squiggle” icon to open the blueprint overview for your project.

Eslint for NestJs Blueprint overview
The status overview allows you to see the status of the data pipeline for your project.
Configuring Sync Settings for Local
Because this is a local instance you can go to settings and change the sync frequency to “Manual”.
This isn’t required but makes sense for local instances.
Then you can use the blueprint status page and the “Run Now” button to manually get the latest data when you need to.
Viewing the DORA metrics
Ok so now that you have all the data downloaded, filtered and transformed into the DORA metrics you can view them in Grafana.
Click on the “Dashboard” menu button to open Grafana.
Then click on the magnifying glass icon in the left-hand menu to open the search bar.
Search for “DORA” and you should see a dashboard called “DORA”.
The image is the metrics for my small open source project. I update it once a month maybe. The users do report issues occasionally so I guess now I’ll have to fix them in a bit quicker!
You can filter to a specific Github Repo if you added more than one.
Along with DORA there are 10-20 other pre-built reports you can access. Here’s one for Github stats.

Github engineering report on Grafana
SaaS Platforms for DORA Metrics
It’s important to mention that there are some excellent platforms for tracking DORA and more metrics if you want more mature, managed applications with support.
Multitudes
Multitudes tracks DORA but supplements engineering metrics with around well-being and collaboration.
More details on the multitudes site.
Linear B
LinearB tracks DORA metrics and helps you fix workflow issues.
More details on the LinearB site.
Developments in Engineering and DevOps Metrics since DORA 2020
There have been developments since these metrics were first published in 2020 and it’s a rapidly changing, exciting space.
The DevOps report of 2022 changed the categorisation to “Low, Medium, High”, removing the “elite” name.
They also added a 5th dimension to DORA for reliability.
Microsoft released their SPACE metrics paper in 2021 and arguably they are much more human focused which is great.
It’s worth reading the microsoft docs for SPACE and the Future of Work Report - https://www.microsoft.com/en-us/research/publication/the-space-of-developer-productivity-theres-more-to-it-than-you-think/
Conclusion
It’s easier than ever to track your DORA metrics. You can use a local instance of Apache Dev Lake or a SaaS platform like Multitudes or LinearB.
If you’re interested in tracking DORA metrics in your organisation, I’d recommend starting with a local instance of Dev Lake. It’s free and you can get started in minutes.
Like anything, don’t over do it with these metrics. They’re just a tool to help you improve your engineering practices. They shouldn’t be used as a KPI.


