
- Disclaimer and Introduction
- How were the metrics gathered?
- 2,000 Requests per Second
-
3,000 Requests per Second
- Dev.to can't link to same-name sections 😔
-
5,000 Requests per Second
- But they exist, and they're awesome!
- Final Considerations
Disclaimer and Introduction
This blog is primarily for fun and educational exploration. The results here should not be the sole basis of your technical decisions. It does not mean that one language is better than the other, please do not read it so seriously.
In fact, it does not make much sense to compare such different languages.
Cool, with that being said, let's have some fun, compare some metrics, and get a better understanding of how both languages deal with some key aspects (RAM, CPU, Open File Descriptors Count & OS Threads Count) when under severe pressure.
How were the metrics gathered?
If you want to know how this benchmark was profiled, expand the below section, otherwise, you can skip directly to the results 🤓.
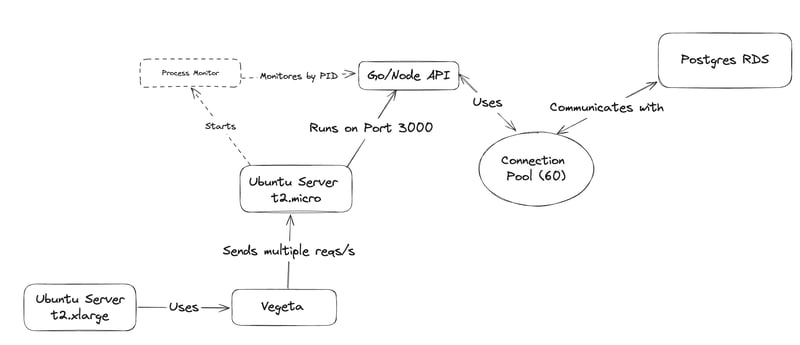
It was created using the following technologies: Important: The API server has only a 1-core processor with 1GB of RAM. This post shows the efficiency of both approaches in a very limited environment. You can check the full code here. How does the communication happen? Both servers are located within the same VPC in AWS, ensuring minimal latency. However, the RDS, although situated in the same AWS Region (sa-east-1), operates in another VPC, introducing a more realistic latency. This is good because, in a real-world scenario, there will be latency. Unfortunately, I wasn't able to set up the Postgres RDS with OpenTofu, (cough cough: skill issue) so I had to manually craft it on AWS and execute the following script: Ok, with everything in place, it's showtime! Start the environment with: What does it do? With this setup, I can access the API server and initiate either the Node or Go API. Concurrently, start the monitor_process.sh to snag metrics like RAM, CPU, Threads Count, & File Descriptors Count and save to a All is done based on the process ID of the running API. Once the API is running, I get the process ID using Then, I can simply run: This command monitors our process, updating a .csv file named process_stats_2000.csv every second with fresh data. Ok, now let's analyze the results, compare both APIs, and see what learnings can we squeeze from it, let's get started!Behind the scenes
Tech Stack
Flow Diagram
Manual RDS Setup
CREATE TABLE IF NOT EXISTS users (
    id SERIAL PRIMARY KEY,
    email VARCHAR(255) NOT NULL,
    password VARCHAR(255) NOT NULL
);
TRUNCATE TABLE users;
Environment Initialization
tofu apply -auto-approve
Monitoring Process
.csv file.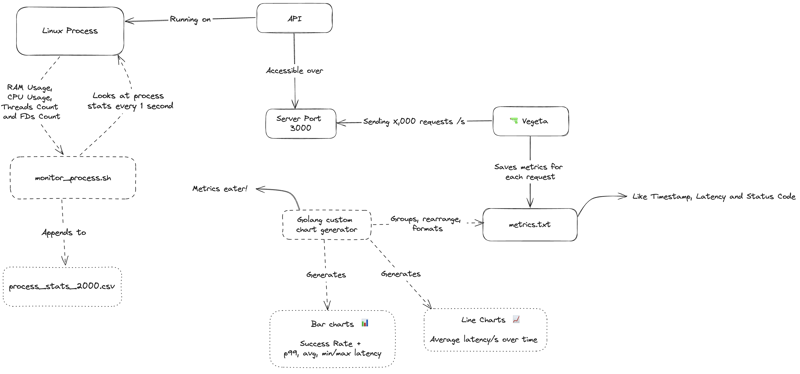
Script Parameters
console.log(process.pid) on Node or fmt.Printf("ID: %d", os.Getpid()) on Golang.
./monitor_process.sh 2587 2000
2,000 Requests per Second
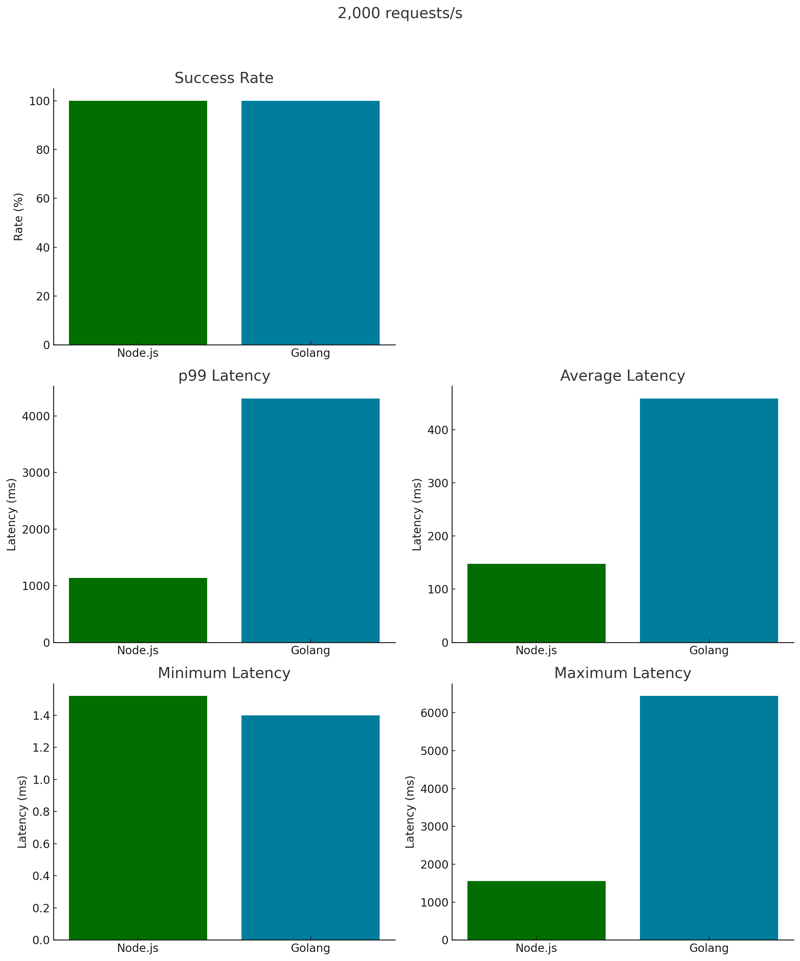
Alright, for this first step, I ran this Vegeta script that fires 2,000 requests per second over 30s to the Server API.
This was done inside the Gun Server by running
./metrics.sh 2000
Which produces the following output:
Starting Vegeta attack for 30s at 2000 requests per second...
Then, I combined the results in some beautiful charts, let's take a look at them:
Latency x Seconds
By looking at the latency chart, we can see that Golang struggled a lot initially, taking ~5s to stabilize.
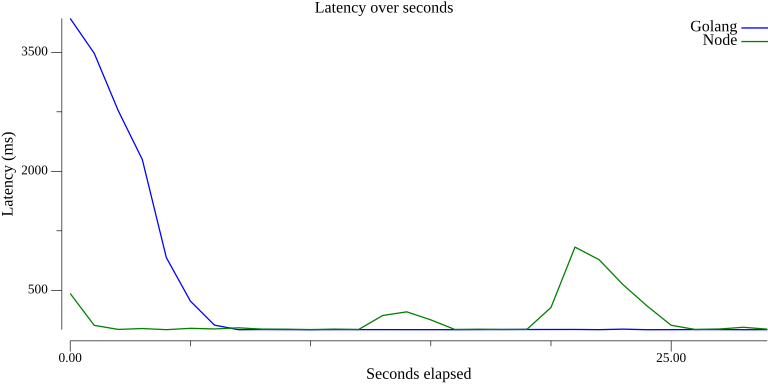
This may have been a one-time anomaly, but as I won't redo the test and the metrics are all correct, I'll call this one a lucky shot for Node.
Node kept a consistent latency throughout most of the test, with spikes at 12s and 20s.
Golang, on the other hand, had some trouble stabilizing the latency at the beginning, costing the pole position. However, It went well after that, by keeping the latency around 230ms.
File Descriptors Count
This one is interesting.
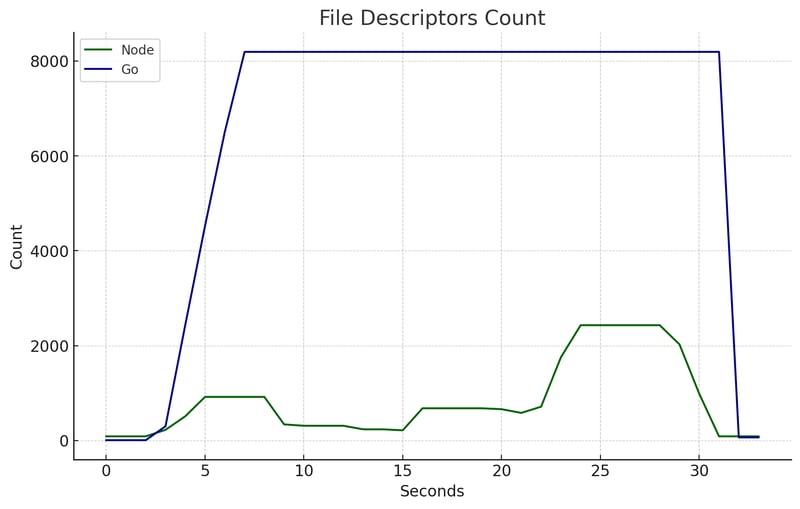
In Linux, a new socket and a corresponding File Descriptor (FD) are created for each incoming server connection. These FDs store connection information.
On Ubuntu, the default soft limit for open file descriptors is 1024.
However, both Go and Node ignore the soft limit and always use the hard limit. This can be verified by accessing the /proc/$PID/limits FD after the node/go process has started.
You can use the command ulimit -n to see the OS soft limit of open file descriptors of the current shell session.
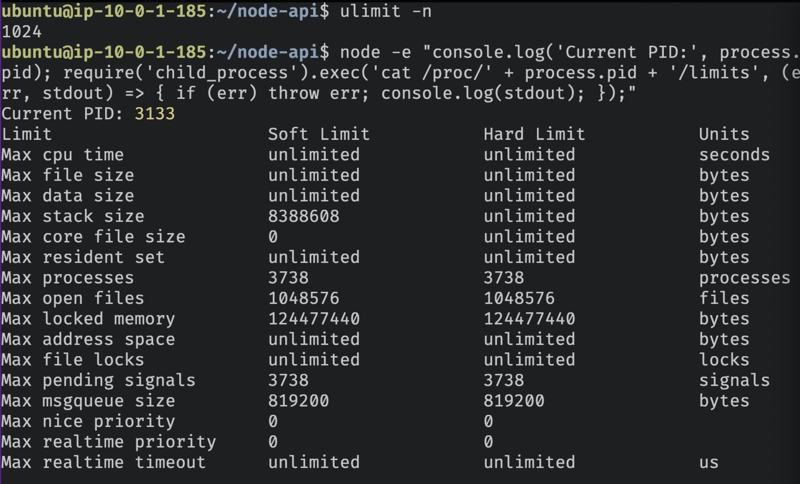
Ok then, this means that the OS does not interfere with the number of open FDs; the programming language manages it.
In this test, Node kept a lower, but irregular, number of open FDs while Golang spiked until 8.000, stabilized, and remained consistent until the end.
Threads Count
Wasn't Node.js single-threaded? 🤯
Well, no.
By default, Node starts a few threads:
- 1 Main Thread: Executes JavaScript code and handles the event loop.
-
4 Worker Threads (default libuv thread pool)
- Handles blocking async I/O such as DNS lookup queries, crypto module, and some file I/O operations.
-
V8 Threads:
- 1 Compiler Thread: Compiles JavaScript into native machine code.
- 1 Profiler Thread: Collects performance profiles for optimizations.
- 2 or more Garbage Collector Threads: Manages memory allocation and garbage collection.
- Additional Internal Threads: Number varies, for various Node.js and V8 background tasks.
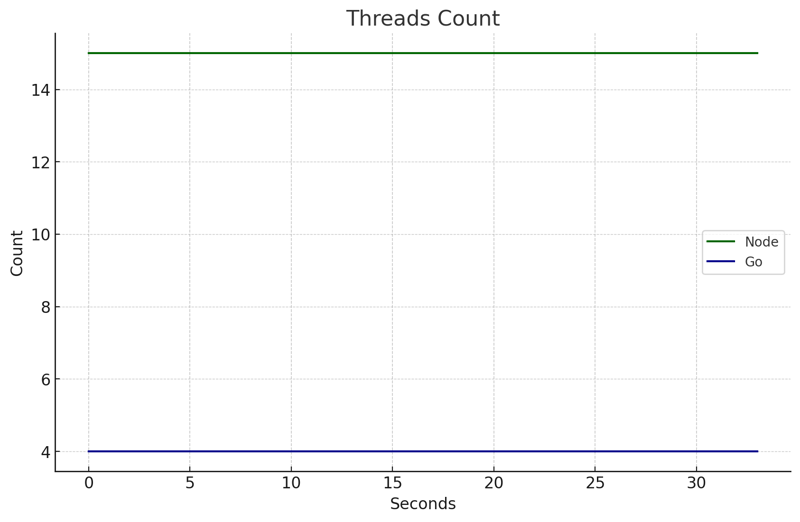
I noticed that, at the startup of the Node Process, it created 11 OS threads and once the requests started arriving, the count jumped to 15 OS threads and stayed there.
Go, on the other hand, kept 4 stable OS threads.
RAM
TL;DR
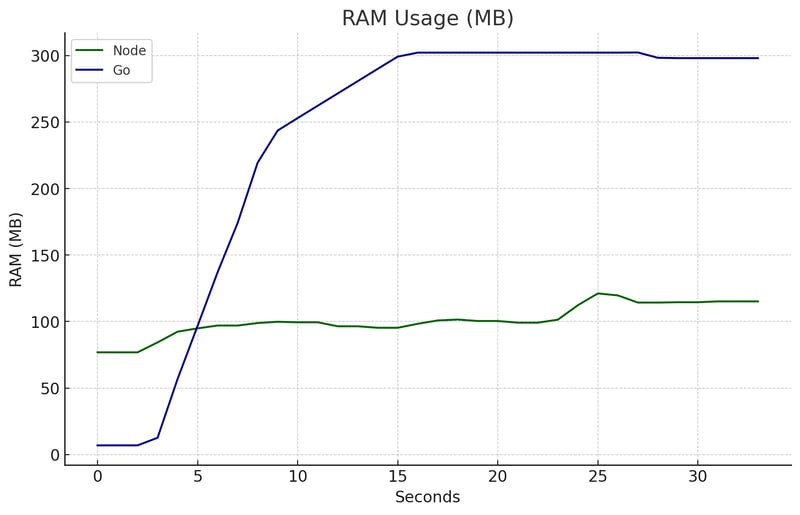
Meanwhile, Go's RAM usage increased in the first seconds until it stabilized at 300MB (almost tripling Node's peak). This difference can be explained due to how both languages deal with asynchronous operations, like I/O database communication. Node uses an Event-Loop approach, which means it doesn't create new thread. In contrast, Go often spawns a new goroutine for each request, which increases memory usage. The goroutine is a lightweight thread managed by the Go Runtime. Even though lighter than an OS Thread, it still leaves a memory footprint when under heavy load. For insights on the Node Event Loop, check this blog post I wrote. To better understand the Go Runtime scheduler, please watch this phenomenal talk - one of the best I've ever watched.Explanation
Node kept a lower and more stable RAM usage, between 75MB and 120MB, throughout the test.
CPU
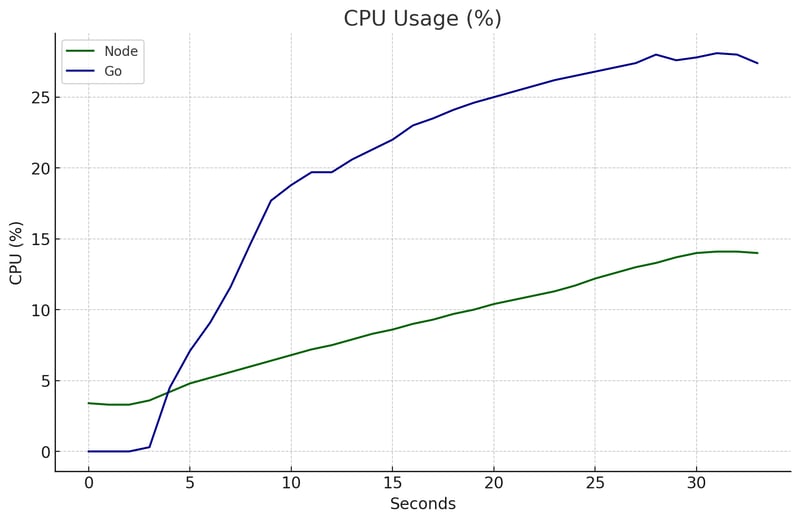
Node was able to use less CPU than Go at this one, this may be because the Go Runtime is more complex and requires more steps/calculations than the libuv's Event Loop.
Overall
I must be honest: I was surprised by this result.
Node won this one 🏆.
It showcased:
- Superior p99 latency, responding in under 1.2s for 99% of requests, compared to Go's 4.31s
- Faster average latency, clocking in at 147ms versus Go's 459ms, 3.1x faster!
- Significantly smaller maximum latency, peaking at just 1.5s against Go's 6.4s, which was 4.2 slower. (c'mon Gopher, you're looking bad!)
3,000 Requests per Second
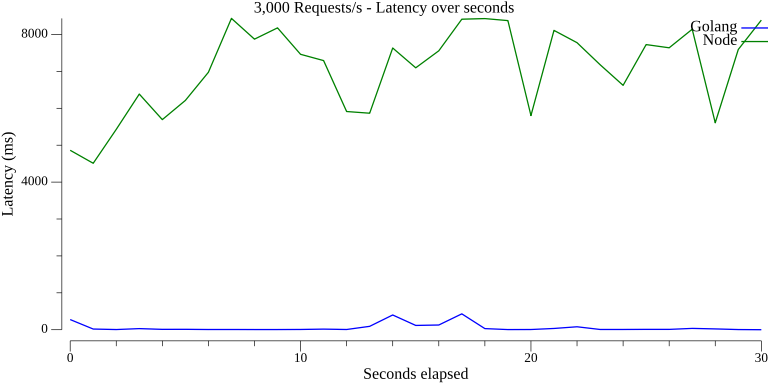
Now let's redo the test, send 3,000 requests/s over 30s for each API, and see the results.
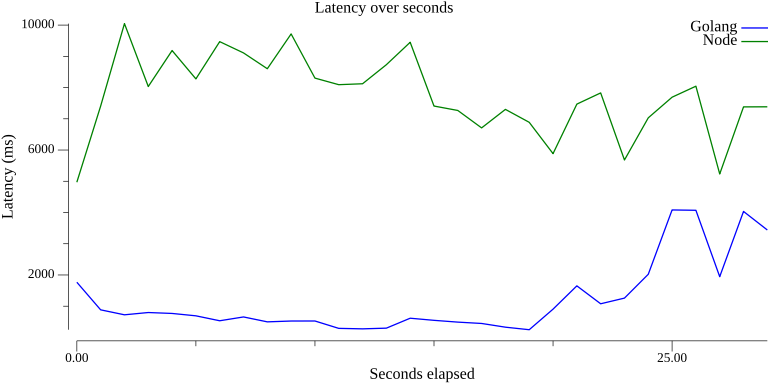
Latency x Seconds
While Go was able to keep a really stable latency with only two small spikes, Node was in some deep trouble and showcased a very inconsistent latency throughout the test.
File Descriptors Count
Remember I told you that neither Node nor Go respects the soft limit of the Open File Descriptors and both languages manage it by themselves?
Here's a fun fact:
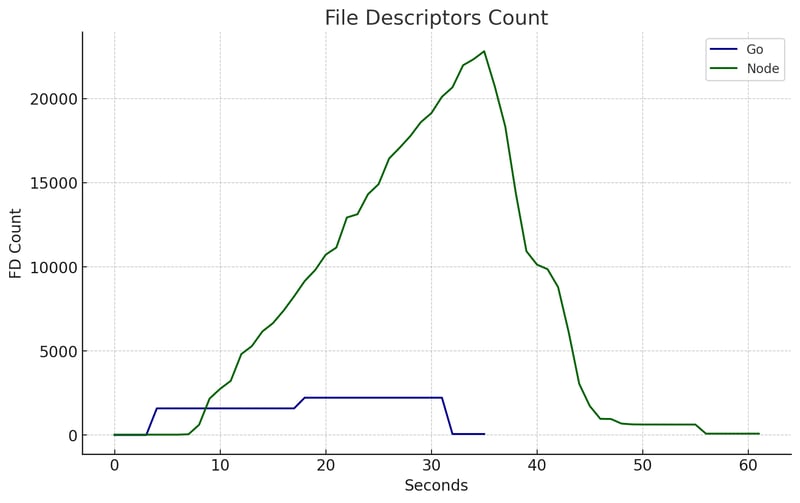
Golang was able to process, handle, and deliver more requests, in a shorter time, using fewer resources by setting a "hard" limit of open FDs at each period of the test (based on some metric that I'm not sure which one).
This is super cool!
Look at how Go managed its FDs:
- 8 FDs: In the first 0-3 seconds
- 1,590 FDs: Between 4-17 seconds
- 2,225 FDs: Between 18-31 seconds
Node, on the other hand, didn't interfere with the open file descriptors like Go did. You can see that on the chart.
Empirically, it seems that Go is pre-allocating (or pre-opening) File Descriptors at some rate and reusing them instead of generating one for each connection at the time they arrive.
I'm not sure exactly how they do that, though, feel free to comment if you have some hint 😄
I found some good reads about this:
-
Does net/http have connection pool? - talks about Go's
net/httppackage and how it manages connections. - The Go Netpoller - article that explains about the Go Netpoller.
Threads Count
Ok, something worth noticing happened on this test.
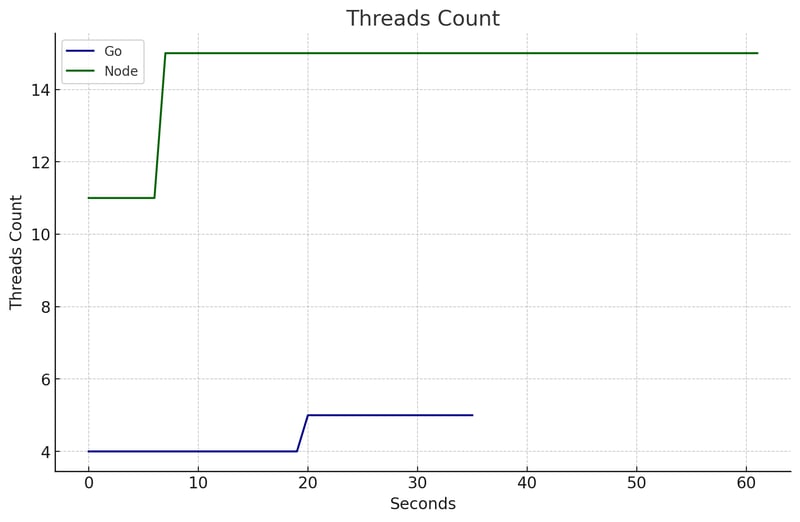
Node: peaked from 11 to 15 OS Threads as the requests started arriving. I believe this is due to the DNS Lookup operations, as briefly mentioned in this issue.
Go: Stepped up its game from 4 to 5 OS Threads. It's the Runtime Scheduler orchestrating the show, Go is smart enough to pack multiple Goroutines into each OS Thread. When it gets clumsy, it smoothly starts a new OS thread.
This approach is not just efficient; it's a masterclass in resource optimization, squeezing every last bit of performance from the hardware. It is Amazing! 🚀
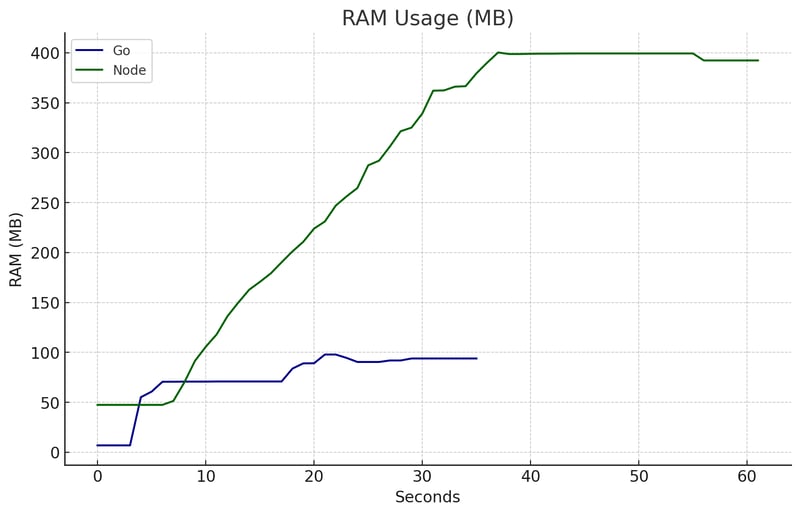
RAM
At this time, you probably noticed that the Node.js line lasts longer than the Go line, well, this is because the API took more time to answer all the requests it received.
This has also impacted the RAM usage. Remember that for the first test Node's RAM usage was way below Go's one?
That's not the case when you have tons of connections hanging on the server waiting to be processed.
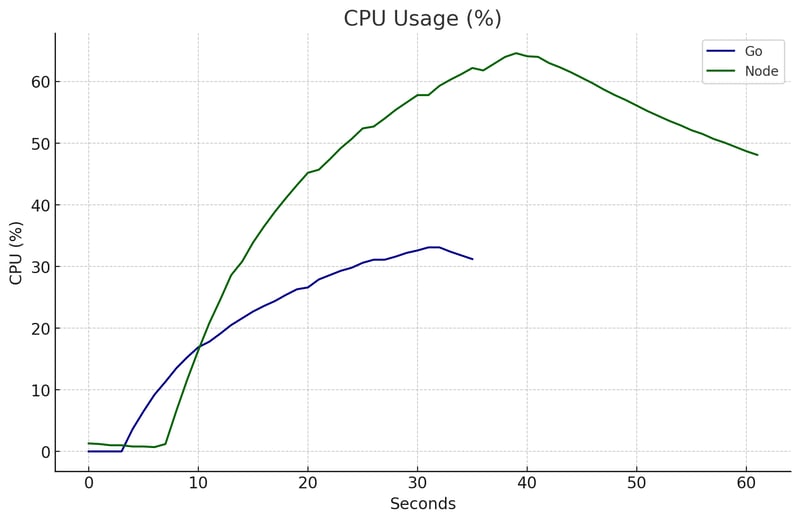
CPU
This time, Node required much more CPU Usage than that and was able to keep the usage below 35% while Node peaked at 64%.
Overall
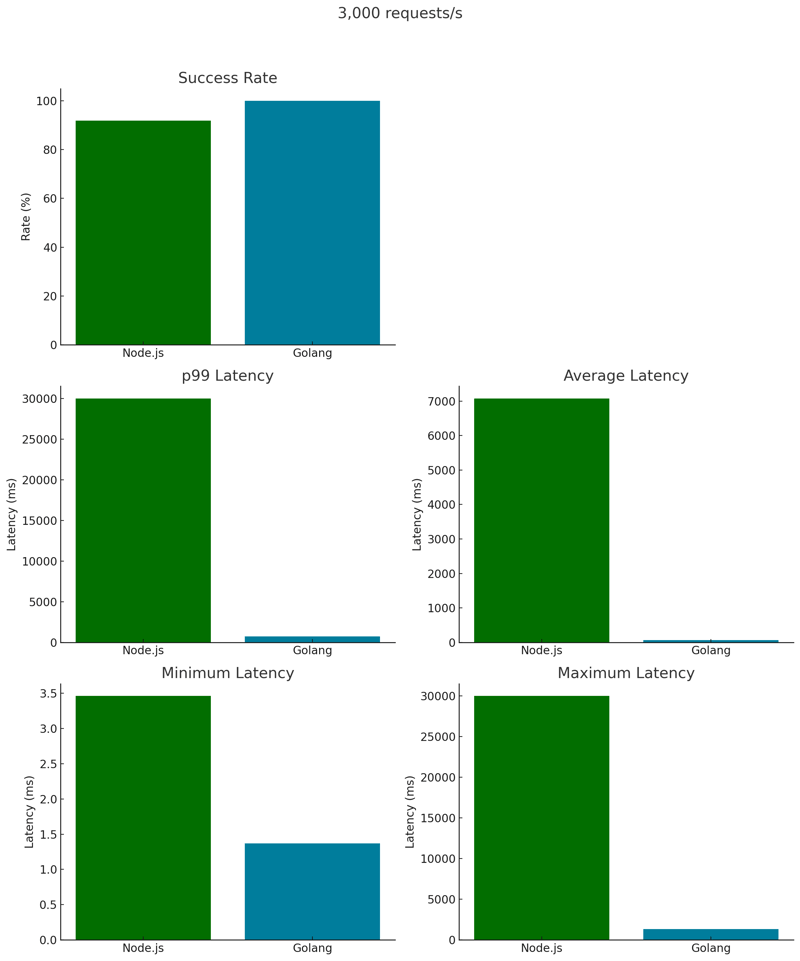
🎉 We have a fight! 🎉
The dispute is open and Golang was way superior at this one, let's look at the numbers:
Golang had:
-
Lower Latencies
- p99: 738.873ms against 30.001s, 40 times lower than Node.
- Average: 60.454ms versus 7.079s - 118 times faster
- Maximum: Go peaked at 1.33s, while Node reached the sky with 30.0004s.
-
Perfect Success Rate (100%)
- Against 91.93% from Node, which had some requests failing.
That was a massacre, it was like comparing a new sports car with a Fusquinha.
Status Codes: All 90,001 requests were successful (201 code). Throughput: Go had a higher throughput compared to Node. Latencies: Node exhibited significantly higher latencies, especially in the mean, 95th, and 99th percentiles. Success Rate: Go achieved a 100% success rate, whereas Node had a lower success rate with some failed requests.Detailed comparison
Node.js Performance Metrics:
Golang Performance Metrics:
5,000 Requests per second
Final round, let's see how both languages deal with severe pressure.
Latency x Seconds
Go was able to keep a very low, stable latency until ~20 seconds, when it started to present some troubles, that caused peaks of 5s, which is very slow.
Node presented problems throughout the entire test, responding with latencies between 5-10s.
It's nice to notice that even in a very stressful test, Go could be stable over the entire test.
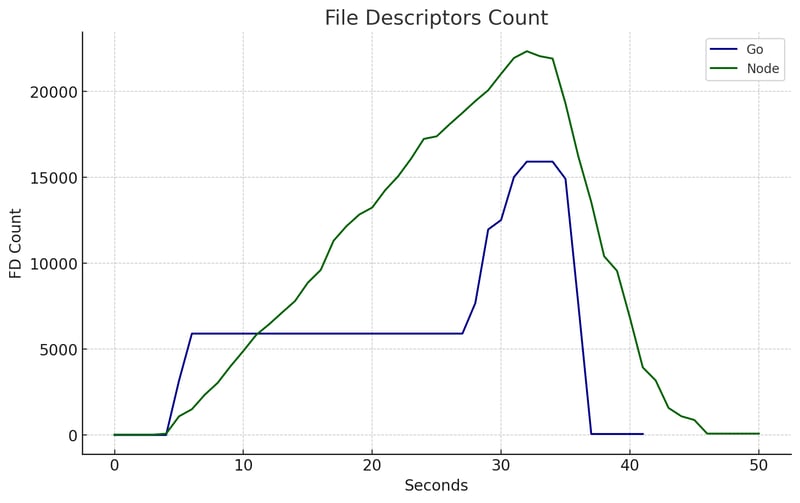
File Descriptors Count
Once again we can see how stable are the Open File Descriptors of Golang versus how unmanaged, linear-growing they are for Node.js
I believe that this is directly related to the Go Network Poller that reuses (and maybe pre-creates) File Descriptors instead of creating one at the time each request arrives.
I wonder if Node could benefit from such an approach, will definitely check this out 😅
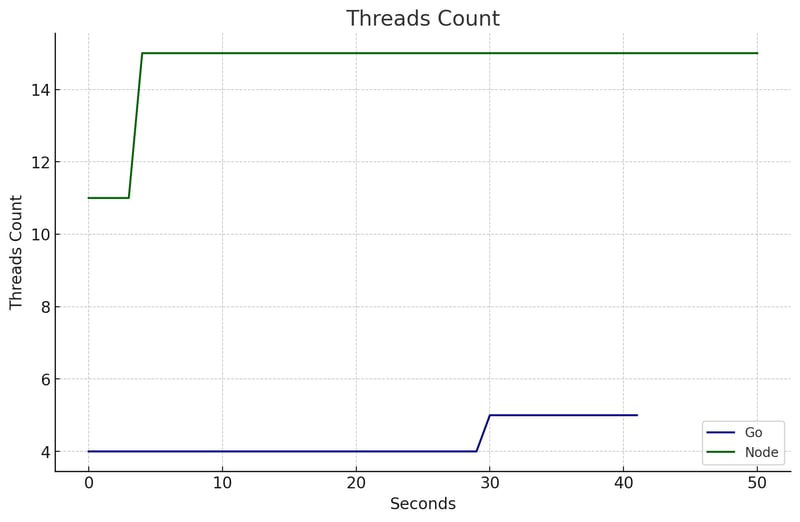
Threads Count
In this chart we can see that Node started with 11 OS Threads and jumped to 15 whenever connections started arriving, while Golang kept 4 OS threads for the majority of the test, increasing to 5 at the end.
Go's strategy seems to be more stable under heavy loads.
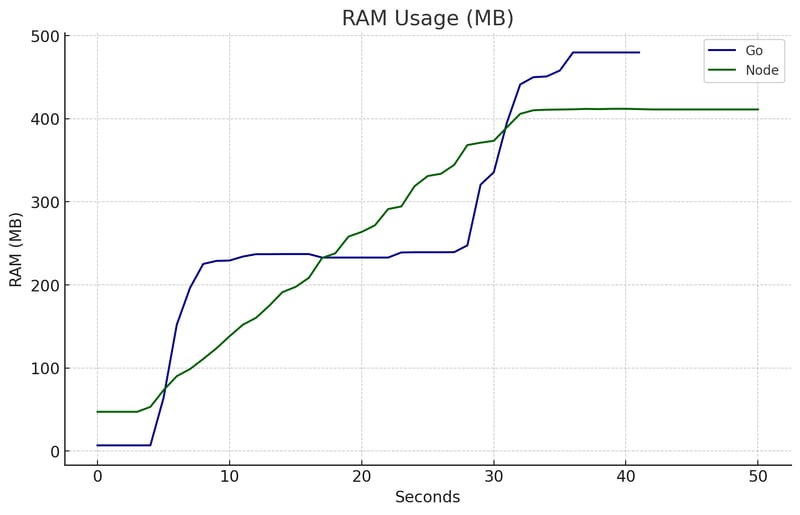
RAM
Node.js showed a linear increase in RAM usage, whereas Go's increase was step-like, similar to climbing a ladder.
This pattern in Go is due to its runtime actively managing resources and setting limits for go routines, OS threads, and open file descriptors.
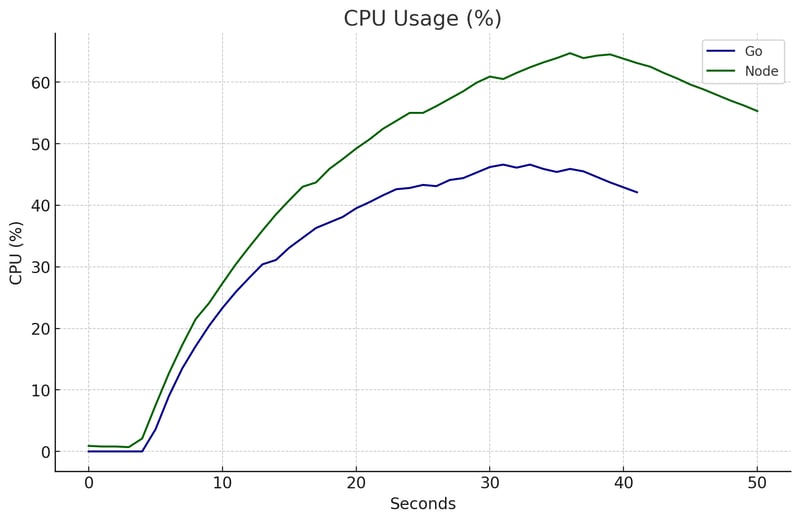
CPU
The CPU usage pattern is very similar for both languages, suggesting that this may be outside of the language control, being delegated to the OS.
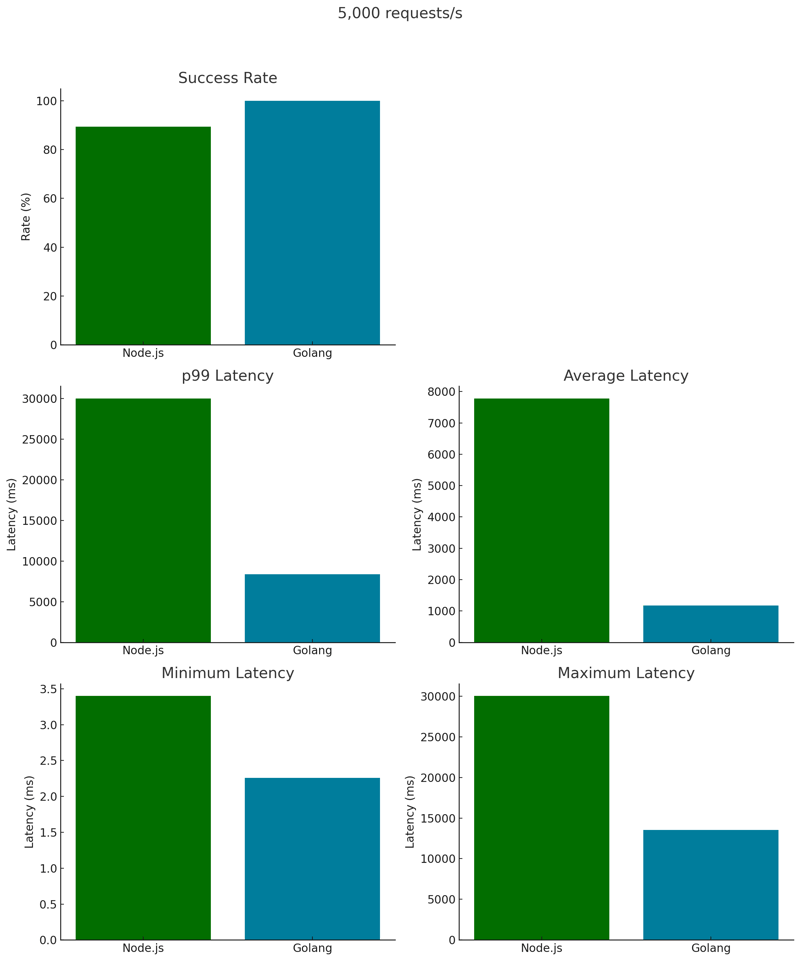
Overall
Go excels again with a higher Success Rate and lower p99, average, min, and max latency.
Given that Go is a compiled language, and Node.js (JavaScript) is interpreted, this outcome is expected.
Compiled languages typically have fewer steps before executing machine code.
Despite its inherent challenges, Node.js managed to successfully process 89.38% of the requests.
Final Considerations
Thank you for taking the time to read this blog post 🙏
It's no surprise that Go, a compiled language focused on concurrency and parallelism by design, came out on top. Still, it was interesting to see how it all played out.
It was cool to see how Go and Node.js handle tasks differently and how that impacts the computer's resources.
I've summed up the key points below.
Open File Descriptor Management
- Go: Demonstrates a strategy of pre-allocation and reuse for File Descriptors, thanks to its intelligent network poller and resource management. This approach contributes to efficient handling and scalability under heavy network loads.
- Node.js: Shows a dynamic, maybe unmanaged pattern in File Descriptor usage, reflecting its approach to handling server connections and opening FDs one by one.
Thread Management and Node.js
- Go: Maintains a stable, low OS thread count, highlighting the efficiency of its runtime scheduler in optimizing thread usage, especially under heavy stress 🤯.
- Node.js: Contrary to popular belief, Node.js uses multiple threads for tasks like DNS lookups, Garbage Collector (Hi V8), and blocking async I/O ops, it's not just a single thread.


