Black Friday Performance Testing Experiment Results I conduct some sort of performance testing around holidays season every year. Couple of years ago, I was doing it manually and keep it myself. But this year, I did a semi-automated performance testing experiment on US retailers. This blog post will slice and dice the performance data of the experiment; I hope it reveals some interesting facts.
Black Friday Performance Testing Experiment Setup
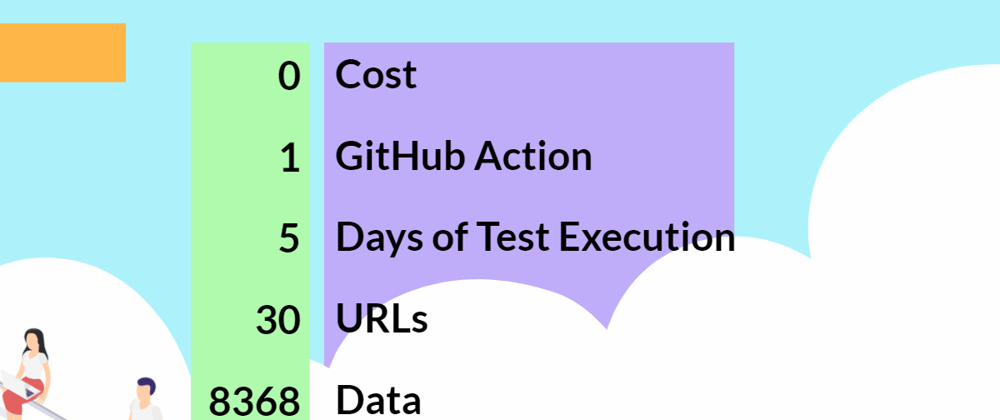
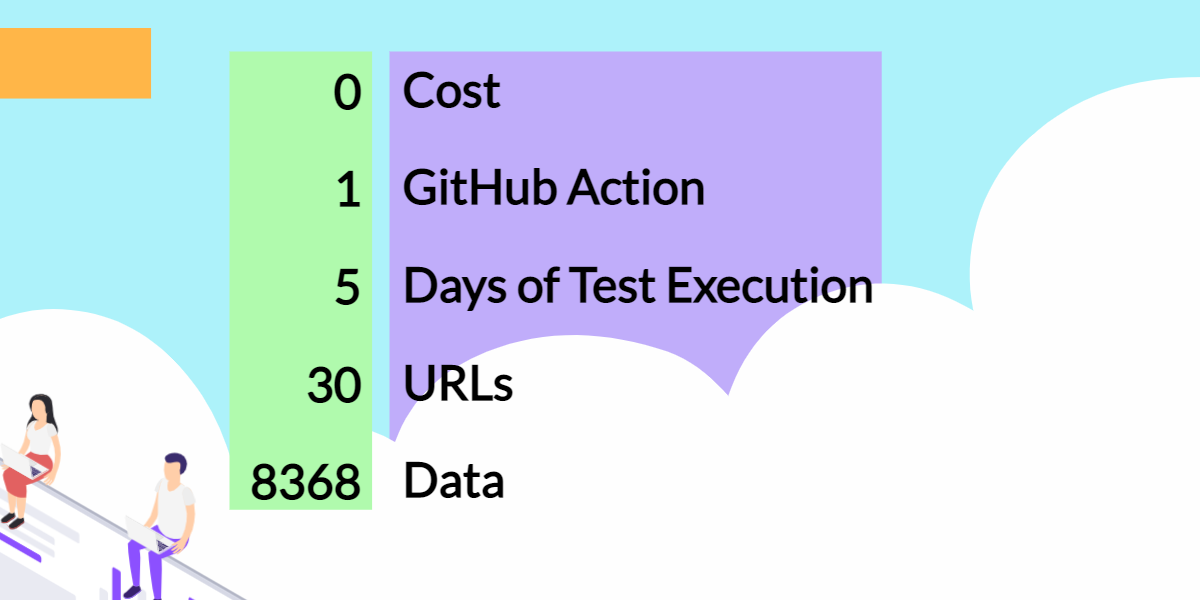
If you would like to conduct this experiment on your own it will costs you nothing. The only setup you have to do is API keys. Below is the GitHub repository which will help you get started.
The objective of this exercise is to measure the response time trend of popular US retail websites during Thanksgiving and Black Friday 2021. This will help us to reveal the performance and its effect of retain giants.
🔝 Strategy
This experiment will not inject load to the websites under test. The script will send only one HTTP(S) request every 30 minutes to measure the performance. The actual workload will be from the real users.
HTTP request timeout is set to 30 seconds. If the script doesn't receive any response from Page Speed, then that request will be ignored.
Only the desktop performance will be captured.
🌐 List of Websites under test
Here are the URLs which will be tested. If you would like to add any other websites, please submit a PR.
The objective of this exercise is to measure the response time trend of popular US retail websites during Thanksgiving and Black Friday 2020. This will help us to reveal the performance and its effect of US retail giants.
Black Friday Performance Testing Experiment Results
Strategy
This experiment will not inject load to the websites under test. The script will send only one HTTP(S) request every 30 minutes to measure the performance. The actual workload will be from the real users.
HTTP request timeout is set to 30 seconds. If the script doesn't receive any response from Page Speed, then that request will be ignored.
Only the desktop performance will be captured.
List of Websites under test
Here are the URLs which will be tested. If you would like to add any other websites, please submit a PR.
Create a GitHub Secret PAGE_SPEED_API_KEY in your repo. For instructions, please check here. Never ever expose your API key in your repo.
In your .github/workflows/python-app.yml file, configure your details in the line 41 and 42.
By default, GitHub Action will get triggered on every push.
To schedule the run for every 15 minutes, use the below config in the yaml file.
 on:
  schedule:
    # * is a special character in YAML so you have to quote this string
    - cron:  '*/15 * * * *'
FAQs
Can I view the performance realtime?
No. The setup doesn't include that. But you can download the raw results anytime once the experiment started and analyze it yourself.
What is the cost involved in this experiement?
Nothing. All are using free resources.?
Result Analysis
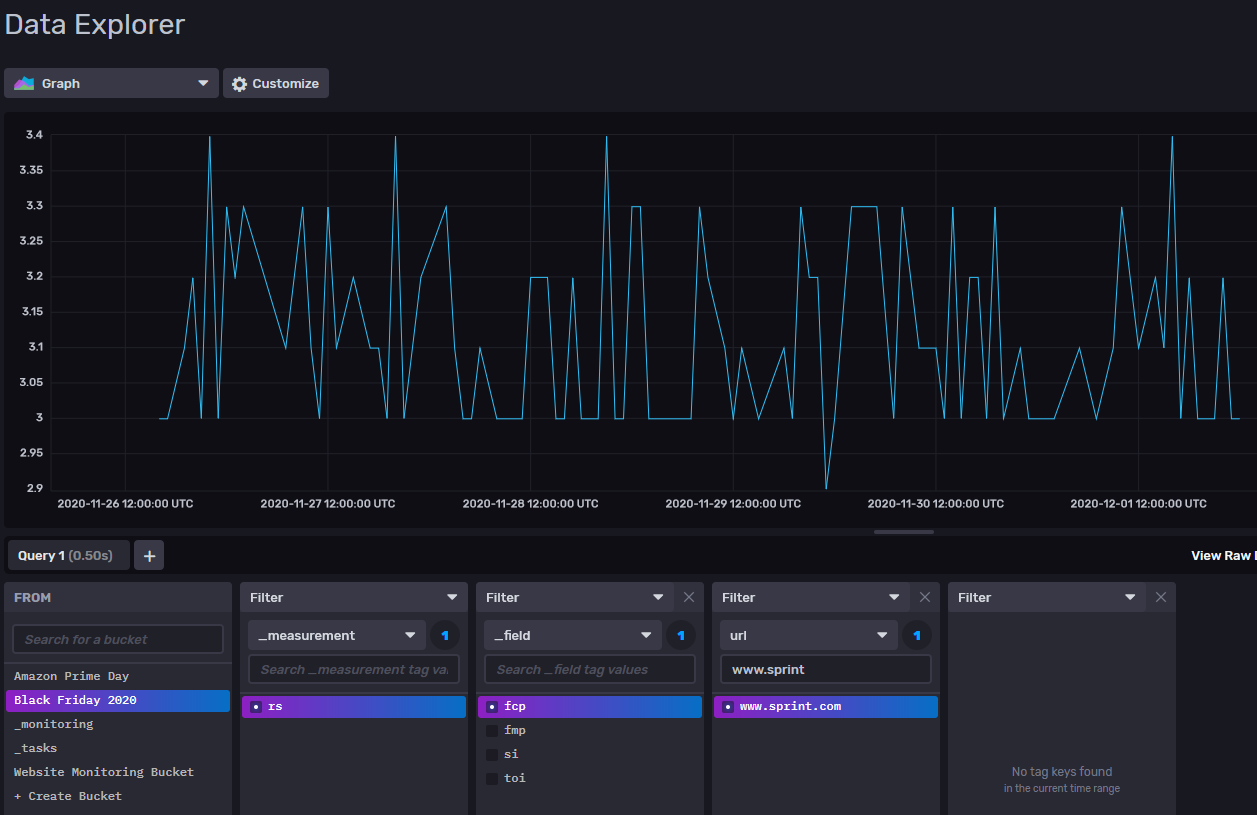
Here comes the interesting part of this experiment. The raw data is present in here.
Before we see the numbers, let us see what is FCP, LCP, FID and CLS is.
“First Contentful Paint reports the time when the browser first rendered any text, image (including background images), non-white canvas or SVG. This includes text with pending webfonts. This is the first time users could start consuming page content.”
“First Input Delay (FID) is an important, user-centric metric for measuring load responsiveness because it quantifies the experience users feel when trying to interact with unresponsive pages—a low FID helps ensure that the page is usable.”
“Largest Contentful Paint (LCP) is an important, user-centric metric for measuring perceived load speed because it marks the point in the page load timeline when the page's main content has likely loaded—a fast LCP helps reassure the user that the page is useful.” -
“Cumulative Layout Shift (CLS) is an important, user-centric metric for measuring visual stability because it helps quantify how often users experience unexpected layout shifts—a low CLS helps ensure that the page is delightful.” -
Lowest FCP is lenovo.com and lowes.com - 905 ms and 908 ms
Highest LCP is sprint.com 9271 ms
Lowest LCP is lenovo.com and lowes.com - 977 ms and 1402 ms
Highest First Input Delay is bjs.com 182 ms
Lowest First Input Delay is wholefoods.com 3 ms
Highest Cumulative Layout Shift Score is harborfrieght.com 181 ms
Lowest Cumulative Layout Shift Score is ofcourse google.com
FCP Max - Sprint.com - Lab data
FCP Low - Lowes.com - Lab data
It will be time consuming to go thru all the 30 URLs data, so I have analyzed only the highest and lowest performance number. If you are interested to deep-dive, you can download the raw results and check it out.
But here is the big 3 (apple, amazon, and google) performance graph.
Big 3 Performance Stats
Below is the Page Speed Insights classification.
Good
Needs Improvement
Poor
FCP
[0, 1000ms]
(1000ms, 3000ms]
over 3000ms
FID
[0, 100ms]
(100ms, 300ms]
over 300ms
LCP
[0, 2500ms]
(2500ms, 4000ms]
over 4000ms
CLS
[0, 0.1]
(0.1, 0.25]
over 0.25
PSI Classification
Below URLs clocked < 1000 ms FCP:
Google Store
Amazon
BJs
Lenovo
Lowes
Below URls clocked < 2500 ms LCP:
Amazon
Apple
BestBuy
Dell
Kohls
Lenovo
Lowes
Overstock
Verizon
Walgreens
Walmart
Wholefoods
Final Words
As you know this experiment conducted only the subset of retailers, not every website out there. Also, it doesn't conclude which website is better performance or compare with each other. The purpose of this study is to understand the importance of performance and how website performs under heavy load.