You might be wondering why the 2021 State of JavaScript survey is coming out now in 2022.
After last year's round of surveys there were a lot of things we wanted to improve, and as often happens we underestimated the amount of work involved!
But the good news is that the State of JS 2021 survey results (as well as their State of CSS counterpart) bring so many new features, we think it was definitely worth the wait.
Special Announcement: we're doing a State of JS 2021 Livestream! Make sure to tune in!
Facetted Charts

We've given our API the ability to subdivise a given dataset by "facet". In other words, take the various "buckets" corresponding to salary levels, and split them out further by experience level.
You can find these new charts as secondary tabs in the survey results, and they're a great way to get a deeper look at demographics data.
New Chart Types
We always try to add new ways to visualize data in order to keep things fresh. Here's a couple of them.
Tier List
Inspired by the "tier list" meme format made popular by YouTubers like TierZoo, we've added a tier list of JavaScript libraries, based on their satisfaction ratio:

Brackets Wins & Matchups
This year's survey included a couple 8-player tournament-style questions in order to help rank items such as JavaScript pain points or missing features.
The brackets were randomized for every respondent, so the aggregate gives us a good overview of everybody's priorities:

We also have an alternate view that shows you specific matchups between any two items in the bracket:

Custom Charts
Traditionally, data-heavy reports like this one are made by running a dataset through a processing script and outputting a static JSON file.
But one of the things that make our data infrastructure unique is that because we process all data using (what else!) JavaScript, we have the ability to re-run any calculation on demand
This is what powers our coolest feature yet: the ability to modify any API query to create your own charts!

Every chart exposes its own corresponding GraphQL query, so all you need to do is copy that query into our GraphQL API explorer, add the filters you're interested in, then paste the result back into the survey.
This is still a very basic implementation so you can't yet share or export the chart, but you can at least change its title and screenshot it.
Datatables
Speaking of playing with data, we also now offer a table view of the data used in any chart.
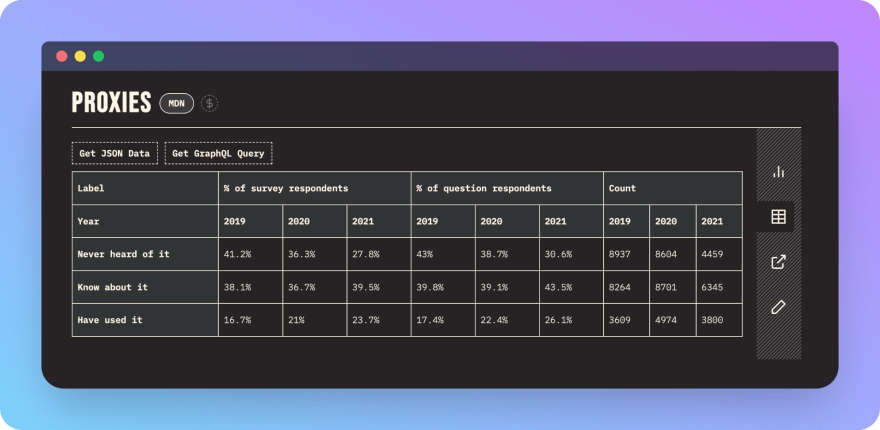
Chart Sponsorships
I've been working on the State of CSS and State of JS surveys pretty much full time ever since last September. It might seem surprising that two yearly surveys would take up 6 months of work, but it makes more sense when you look at how much work is really involved.
So as you can imagine, paying the bills (and sustaining my habit of buying Steam games I'll never play just because they're on sale) has become a bit of a concern.
Thankfully Front End Masters has been a very generous partner from the start, and you can thank them for making the surveys at all possible.
But depending entirely on a single company doesn't feel safe, so this year I'm trying something new in the forms of donations.
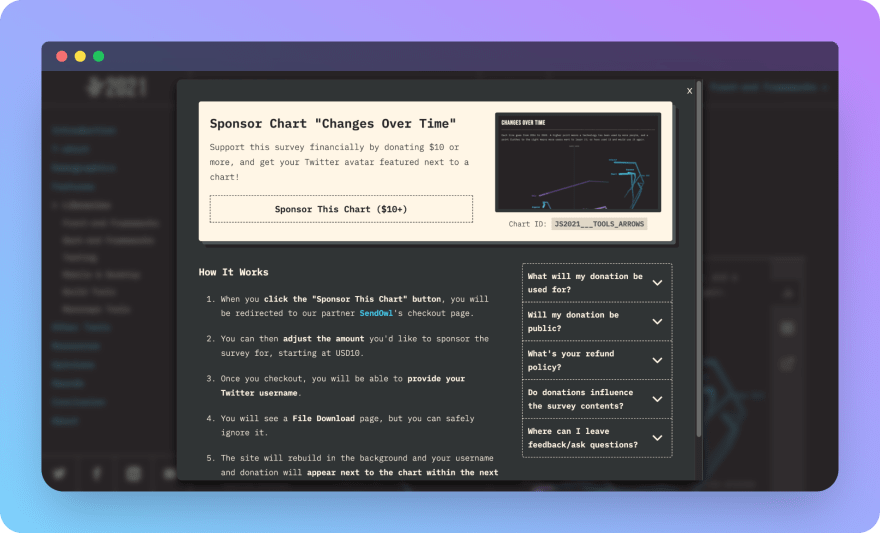
There's a twist though: when you donate, you can pick a chart and your Twitter avatar will then appear as that chart's sponsor! Think of it as the Adopt-a-Highway program for JavaScript charts, or NFTs without the cringey monkeys and carbon emissions.
I have no idea if this sponsorship experiment will be successful or not, and I'm looking forward to seeing the results! And so will you, as every donation is entirely public.
And Much More…
This is just scratching the surface of the hundred of hours put into improving the survey not only by myself, but by dozens of contributors, both volunteer and paid.
And we're not stopping here by any means. We're actually in the process of completely refactoring the app you use to take the survey itself, both to improve performance and to address data privacy issues that were revealed by our recent data leak scare.
This is a big undertaking as it means pretty much rewriting a third of the entire stack (the other two being the API, and the results site – which are probably due for a rewrite of their own at some point!).
I also really, really want to launch more surveys in 2022. This is something I've always wanted to do but I could just never find the time. So if you have topic ideas I want to her them!
Let me conclude with a huge thanks to Kilian, Sarah, Raphael, Alexey, Chris, Philip, Shawn, and all the many other people who make this possible. And of course to you, for checking out and sharing the survey year after year!


