In this micro tutorial we will learn how to create subplots using matplotlib and seaborn.
Import all Python libraries needed
import pandas as pd
import seaborn as sns
from matplotlib import pyplot as plt
sns.set() # Setting seaborn as default style even if use only matplotlib
Create the DataFrame
We are using the Pokemon with stats dataset from Kaggle.
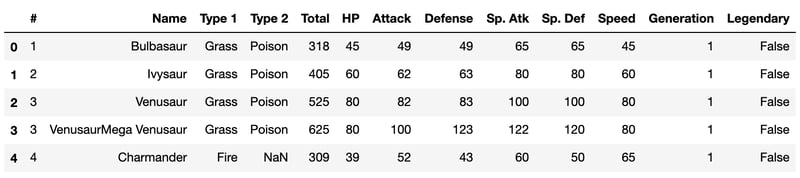
The cell below import the dataset file and create the pokemon pandas DataFrame. So use show the 4 first rows using pd.DataFrame.head function.
pokemon_filepath = '../datasets/pokemon.csv'
pokemon = pd.read_csv(pokemon_filepath)
pokemon.head()
Plotting (and subplotting) samples
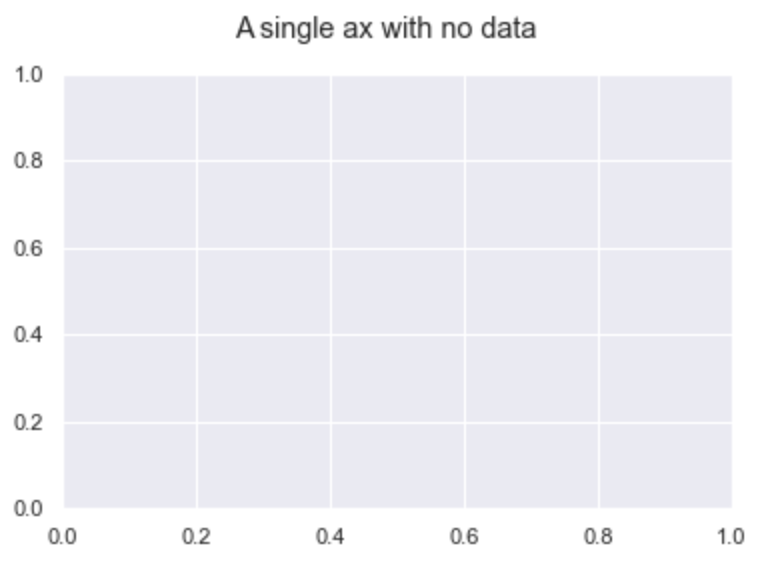
As we can see in the matplotlib documentation (references at the end of file), subplots() without arguments returns a Figure and a single Axes, which we can unpack using the syntax bellow.
fig, ax = plt.subplots()
fig.suptitle('A single ax with no data')
Thus, we can give two arguments to subplots functions: nrows and ncols. If given in that order, we don't need to type the arg names, just its values. In our example we create a plot with 1 row and 2 columns, still no data passed.
fig, axes = plt.subplots(1, 2)
fig.suptitle('1 row x 2 columns axes with no data')
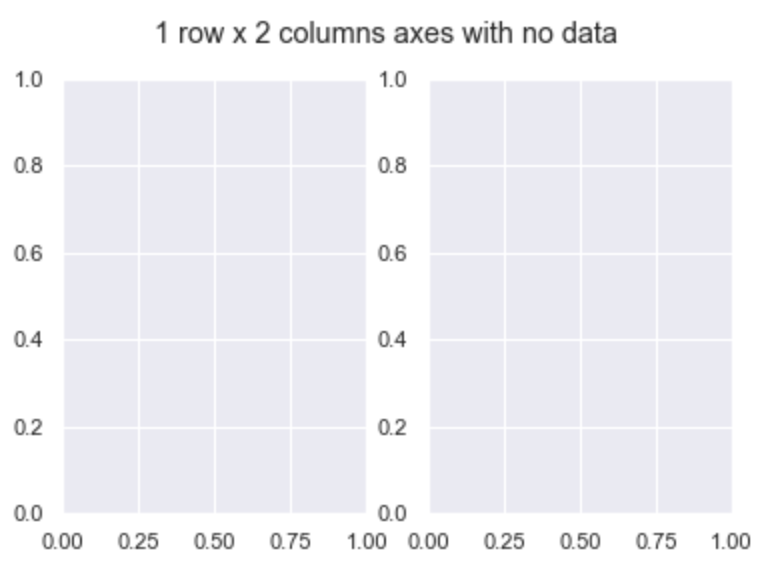
Now axes is an array of AxesSubplot, so we can access each ax separetely and set a different title, for instance.
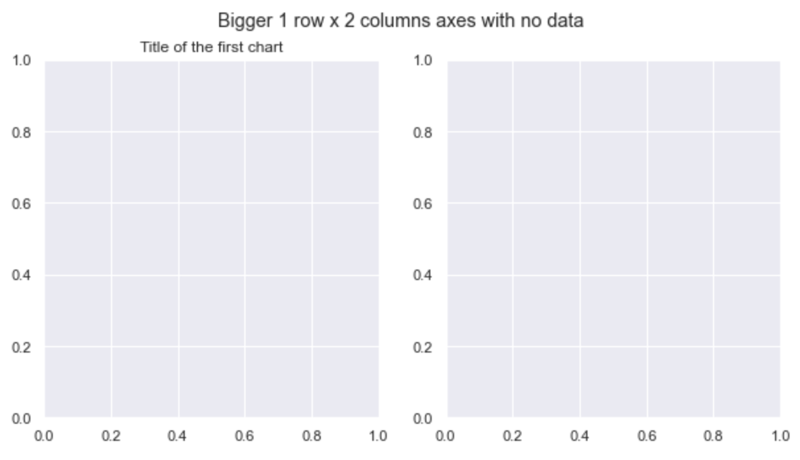
More arguments:
- figsize set the total dimension of our figure
- sharex and sharey are used to share one or both axes between the charts (needed data to work)
fig, axes = plt.subplots(1, 2, sharex=True, figsize=(10,5))
fig.suptitle('Bigger 1 row x 2 columns axes with no data')
axes[0].set_title('Title of the first chart')
An so on
fig, axes = plt.subplots(3, 4, sharex=True, figsize=(16,8))
fig.suptitle('3 rows x 4 columns axes with no data')
Using data
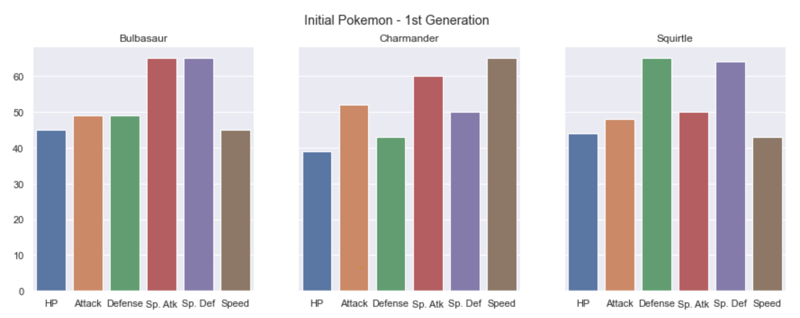
We select three Pokemon to use in the next example. The three initial Pokemon of 1st Generation: Bulbasaur, Charmander and Squirtle.
# bulbasaur = pokemon[['Name', 'HP', 'Attack', 'Defense', 'Sp. Atk', 'Sp. Def', 'Speed']][pokemon.loc[:, 'Name'] == 'Bulbasaur']
poke_num = pokemon[['Name', 'HP', 'Attack', 'Defense', 'Sp. Atk', 'Sp. Def', 'Speed']].set_index('Name')

bulbasaur = poke_num.loc['Bulbasaur']
charmander = poke_num.loc['Charmander']
squirtle = poke_num.loc['Squirtle']
Then, we create a plot with 3 subplots in a 1 row x 3 columns figure.
We use sns.barplot where we need to set the a argument with the correspondent element from axes variable.
fig, axes = plt.subplots(1, 3, figsize=(15, 5), sharey=True)
fig.suptitle('Initial Pokemon - 1st Generation')

# Bulbasaur
sns.barplot(ax=axes[0], x=bulbasaur.index, y=bulbasaur.values)
axes[0].set_title(bulbasaur.name)

# Charmander
sns.barplot(ax=axes[1], x=charmander.index, y=charmander.values)
axes[1].set_title(charmander.name)

# Squirtle
sns.barplot(ax=axes[2], x=squirtle.index, y=squirtle.values)
axes[2].set_title(squirtle.name)
Final example
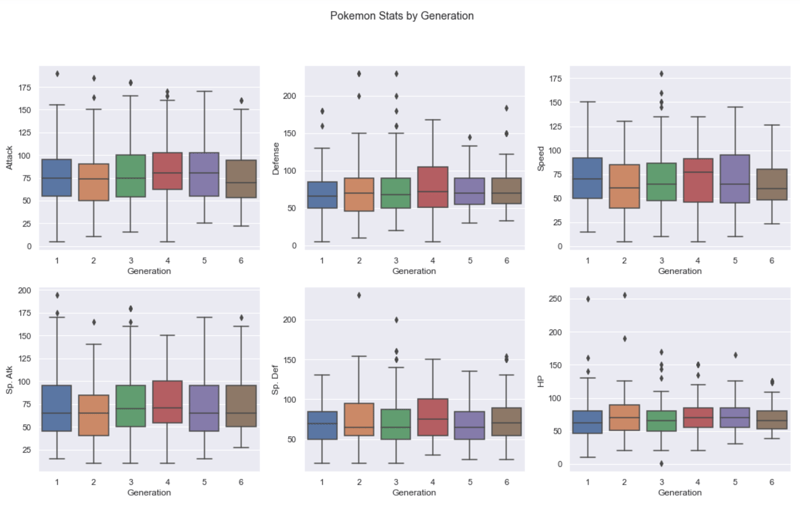
And a final example plottin a 2 rows X 3 columns plot showing Pokemon stats by Generation.
We use sns.boxplot
fig, axes = plt.subplots(2, 3, figsize=(18, 10))

fig.suptitle('Pokemon Stats by Generation')

sns.boxplot(ax=axes[0, 0], data=pokemon, x='Generation', y='Attack')
sns.boxplot(ax=axes[0, 1], data=pokemon, x='Generation', y='Defense')
sns.boxplot(ax=axes[0, 2], data=pokemon, x='Generation', y='Speed')
sns.boxplot(ax=axes[1, 0], data=pokemon, x='Generation', y='Sp. Atk')
sns.boxplot(ax=axes[1, 1], data=pokemon, x='Generation', y='Sp. Def')
sns.boxplot(ax=axes[1, 2], data=pokemon, x='Generation', y='HP')
GitHub repository
 thalesbruno
/
ds-micro-tutorials
thalesbruno
/
ds-micro-tutorials
Data Science micro tutorials using Python
References
matplotlib | Creating multiple subplots using plt.subplot
matplotlib | matplotlib.pyplot.subplots
seaborn | seaborn.barplot
seaborn | seaborn.boxplot


