Prerequisites
- jmx_prometheus_javaagent. (https://mvnrepository.com/artifact/io.prometheus.jmx/jmx_prometheus_javaagent/0.14.0)
- Sample cassandra.yml configuration for jmx_prometheus_javaagent. (https://raw.githubusercontent.com/prometheus/jmx_exporter/master/example_configs/cassandra.yml)
- Prometheus server. (https://prometheus.io/download/)
- Grafana Server. (https://grafana.com/grafana/download)
Steps to follow
- Download jmx_prometheus_javaagent jar file.
- Download cassandra.yml configuration file for producing jvm and cassandra metrics.
- Add JVM_OPTS to cassandra-env.sh file.
- JVM_OPTS="$JVM_OPTS javaagent:/etc/cassandra/jmx_prometheus_javaagent-0.10.jar=7070:/etc/cassandra/cassandra.yml"
- Restart cassandra server. http://localhost:7070/metrics, this URL provides JVM and cassandra Metrics.
- Download Prometheus server.
- Add below lines to prometheus.yml for Prometheus server configuration.job_name: ‘cassandra’static_configs:
- targets: [‘ip:7070’]
- Download Grafana Server.
- Setup Prometheus data source to Grafana.
- Create Metrics dashboard using provided queries in Grafana.
- Grafana dashboard is exposed to localhost:3000.
- Prometheus server exposed to localhost:9090.
Notes
- jmx_prometheus_javaagent is to be added to each cassandra node.
Architecture

How it works
Prometheus scrapes metrics from instrumented jobs, either directly or via an intermediary push gateway for short-lived jobs. It stores all scraped samples locally and runs rules over this data to either aggregate and record new time series from existing data or generate alerts. Grafana or other API consumers can be used to visualize the collected data.
References
- Steps for setting up Cassandra metrics through grafana. (https://community.grafana.com/t/how-to-connect-prometheus-to-cassandra/1153/11)
- https://grafana.com/docs/grafana/latest/
- https://github.com/prometheus/prometheus
- https://prometheus.io/docs/introduction/overview/
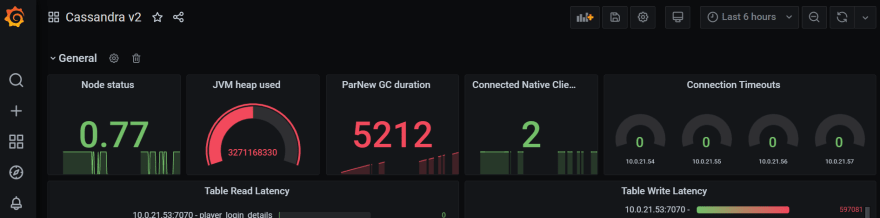
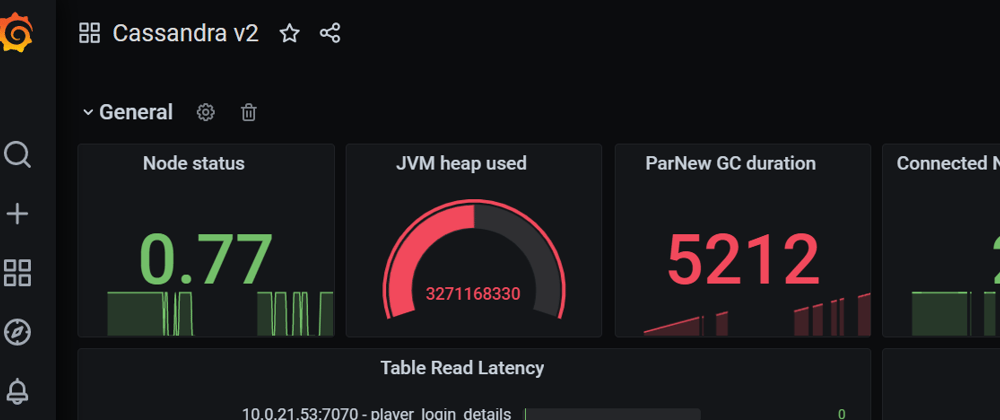
Sample Image