[NOTE: The live web app that encompasses this functionality can be found here: https://www.paintmap.studio. All of the underlying code for that site can be found here: https://github.com/bytebodger/color-map.]
In the previous articles of this series, I went into extensive detail about subjects such as pixelating, color matching, dithering, and color depth. But I wanted to wrap it up by showing how I personally use these features - specifically, as it pertains to my painting.
Color inventory
Once I'm done tinkering with an image in Paint Map Studio, I need some information about the transformed image itself. On the home page, all of the output is in the form of the rendered image. But at some point I'll need to see how that image translates into colors.
When the image has finished rendering, two new links appear in the top nav. One is "MAP". The other is "STATS". First, we'll look at STATS.
STATS shows a list of all paints that were matched in the image, listed in descending order. The most-used paints are at the top. The least-used are at the bottom.
And here's what the Stats component looks like:
// Stats.js

export const Stats = () => {
   const uiState = useContext(UIState);
   const navigateTo = useNavigate();
   const allColors = useAllColors();
   let colors = [];

   const getColorCell = (paintName = '') => {
      const color = uiState.stats.colors.find(color => color.name === paintName);
      return <TableCell style={{backgroundColor: `rgb(${color.red}, ${color.green}, ${color.blue})`}}/>;
   }

   const getTableRows = () => {
      colors = allColors.get();
      const colorCounts = sortColorCounts(uiState.stats);
      return colorCounts.map((colorCount, index) => {
         const [paintName, count] = colorCount;
         const paintIndex = colors.findIndex(color => color.name === paintName);
         return (
            <TableRow
               key={paintName}
               sx={{'&:last-child td, &:last-child th': {border: 0}}}
            >
               <TableCell style={{textAlign: css3.textAlign.center}}><b>{index + 1}.</b></TableCell>
               <TableCell style={{textAlign: css3.textAlign.center}}>{paintIndex}</TableCell>
               <TableCell style={{textAlign: css3.textAlign.center}}>{count}</TableCell>
               {getColorCell(paintName)}
               <TableCell>
                  <span
                     className={'paintName'}
                     id={paintName}
                     onClick={handlePaintNameClick}
                  >
                     {paintName}
                  </span>
               </TableCell>
            </TableRow>
         );
      })
   }

   const handlePaintNameClick = (event = {}) => {
      uiState.toggleHighlightedColor(event.target.id);
      navigateTo('/map');
   }

   const sortColorCounts = (stats = {}) => {
      const sort = (a, b) => {
         const [, aCount] = a;
         const [, bCount] = b;
         if (aCount > bCount)
            return -1;
         else if (aCount < bCount)
            return 1;
         else
            return 0;
      };

      const colorCounts = [];
      Object.entries(stats.colorCounts).forEach(colorCount => colorCounts.push(colorCount));
      return colorCounts.sort(sort);
   };

   const navigateToMap = () => navigateTo('/map');

   if (Object.keys(uiState.stats).length === 0)
      return null;

   return <>
      <h4 className={'marginBottom_8'}>Color Stats</h4>
      <div className={'marginBottom_48'}>
         <Typography>
            These are all the colors represented in your generated image.  To see where these colors exist in the image,
            click on the{` `}
            <span
               className={'spanLink'}
               onClick={navigateToMap}
            >
               MAP
            </span>{` `}
            link in the top nav bar.
         </Typography>
      </div>
      <TableContainer component={Paper}>
         <Table
            aria-label={'used paints table'}
            size={'small'}
         >
            <TableHead>
               <TableRow>
                  <TableCell style={{width: 75}}/>
                  <TableCell style={{
                     textAlign: css3.textAlign.center,
                     width: 75,
                  }}>
                     <b>Ref</b>
                  </TableCell>
                  <TableCell style={{
                     textAlign: css3.textAlign.center,
                     width: 75,
                  }}>
                     <b>Blocks</b>
                  </TableCell>
                  <TableCell/>
                  <TableCell><b>Paint</b></TableCell>
               </TableRow>
            </TableHead>
            <TableBody>
               {getTableRows()}
            </TableBody>
         </Table>
      </TableContainer>
      <div className={'minHeight_500'}></div>
   </>
}
This allows me to see, before I ever begin painting, what paints I need, and in what proportion.
Color mapping
The MAP link leads to a huge table in which every block from the original image is a cell in that table. Each cell contains a number that corresponds to a given paint. How do you know which number corresponds to which paint? You look back at the STATS page. That provides you with the color key.
Here's the code for Map component:
// Map.js

export const Map = () => {
   const uiState = useContext(UIState);
   const navigateTo = useNavigate();
   const allColors = useAllColors();
   let colors = [];

   const getTableCells = (cells = [rgbModel], rowIndex = -1) => {
      const { highlightedColor } = uiState;
      return cells.map((cell, cellIndex) => {
         const paintIndex = colors.findIndex(color => color.name === cell.name);
         const darkness = (cell.red + cell.green + cell.blue) / 3;
         let color;
         let backgroundColor;
         if (highlightedColor === cell.name) {
            backgroundColor = '#39ff14';
            color = 'red';
         } else {
            backgroundColor = `rgb(${cell.red}, ${cell.green}, ${cell.blue})`;
            color = darkness < 128 ? 'white' : 'black';
         }
         return (
            <td
               className={'cell'}
               id={cell.name}
               key={`cell-${rowIndex}-${cellIndex}`}
               onClick={handleCellClick}
               style={{
                  backgroundColor,
                  borderWidth: highlightedColor === cell.name ? 5 : 0,
                  color,
               }}
            >
               {paintIndex}
            </td>
         );
      })
   }

   const getTableRows = () => {
      colors = allColors.get();
      return uiState.stats.map.map((row, rowIndex) => {
         return (
            <tr key={`row-${rowIndex}`}>
               {getTableCells(row, rowIndex)}
            </tr>
         )
      })
   }

   const handleCellClick = (event = {}) => {
      uiState.toggleHighlightedColor(event.target.id);
   }

   const navigateToStats = () => navigateTo('/stats');

   if (Object.keys(uiState.stats).length === 0)
      return null;

   return <>
      <h4 className={'marginBottom_8'}>Color Map</h4>
      <div className={'marginBottom_48'}>
         <Typography>
            This is essentially a paint-by-numbers grid for the image that you generated.  You can copy all of the HTML from the
            grid below paste it into a spreadsheet (like Google Sheets).  The key that tells you which colors map to which
            numbers can be seen by clicking on the{` `}
            <span
               className={'spanLink'}
               onClick={navigateToStats}
            >
               STATS
            </span>{` `}
            link in the top nav bar.  Also, clicking on any of the color squares in the image below will highlight <i>every</i> instance
            of that color in the map.  Clicking the same color again will toggle the highlighting <i>off</i>.
         </Typography>
      </div>
      <table className={'borderSpacing_0'}>
         <tbody>
            {getTableRows()}
         </tbody>
      </table>
      <div className={'minHeight_500'}></div>
   </>
}
The huge table that's thrown onto the screen may feel a bit unwieldy. But I've done this because you can copy-n-paste an HTML table into most spreadsheet products (like Microsoft Excel or Google Sheets) and it will retain most of the information. So once I get it transferred into a spreadsheet, I then use that spreadsheet to guide my painting for the rest of the time that I'm working on the piece.
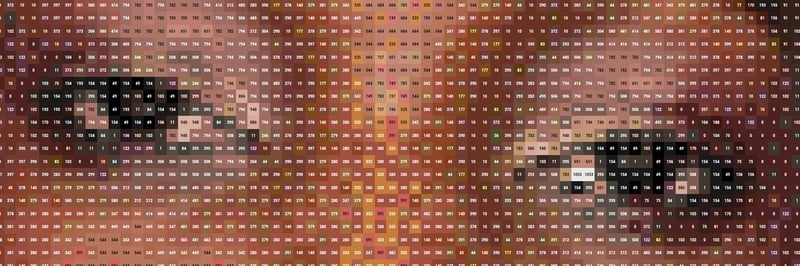
For example, this is a portion of the spreadsheet from the piece that I'm working on now:
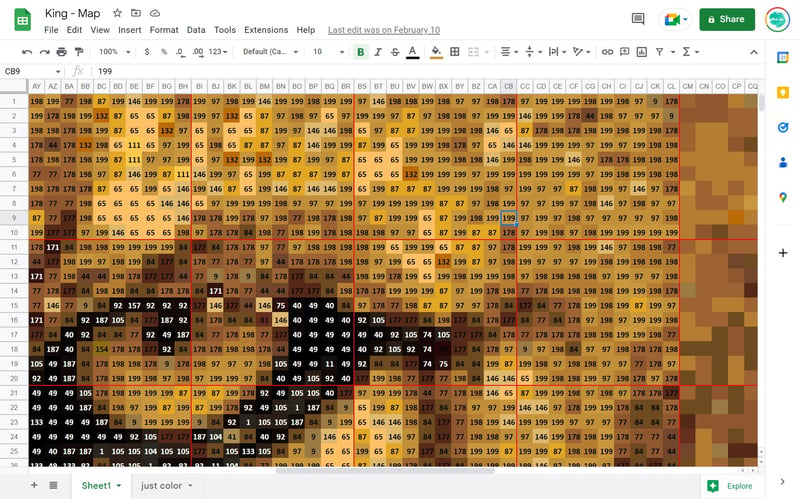
I manually added those red grid lines at 10-cell intervals. They correlate to the grid that I've drawn on my panel. Notice that the cells on the right side of the screen are devoid of numbers. That's because I empty out the numbers once I've painted that section, so it's easy for me to tell, just by looking at the spreadsheet, what I've painted and what I have yet to finish.
I'll also note here that the term "paint by numbers" has a somewhat cheesy connotation. It insinuates that someone with little-or-no talent is creating paintings essentially by using... a coloring book. But this is a bit shortsighted.
For starters, many "real" artists will grid-out their surface before they begin painting. This is especially true when creating very large pieces (think: murals). Sure, there are some people who create large works completely freehand. But mapping out an image before painting it doesn't mean that you're somehow "lesser" as an artist.
Even if you're not painting against a grid, most artists start by doing some level of drawing on the canvas before they begin. Even the great masters of the Renaissance were known to do this. So again, you shouldn't be afraid to put something on the canvas before you start painting - even if what you draw out doesn't map things out in a straightforward grid/map.
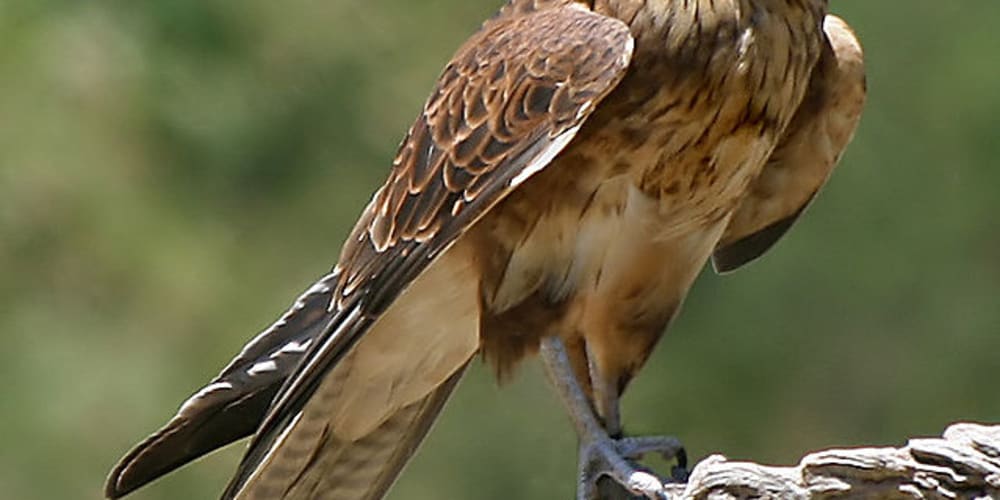
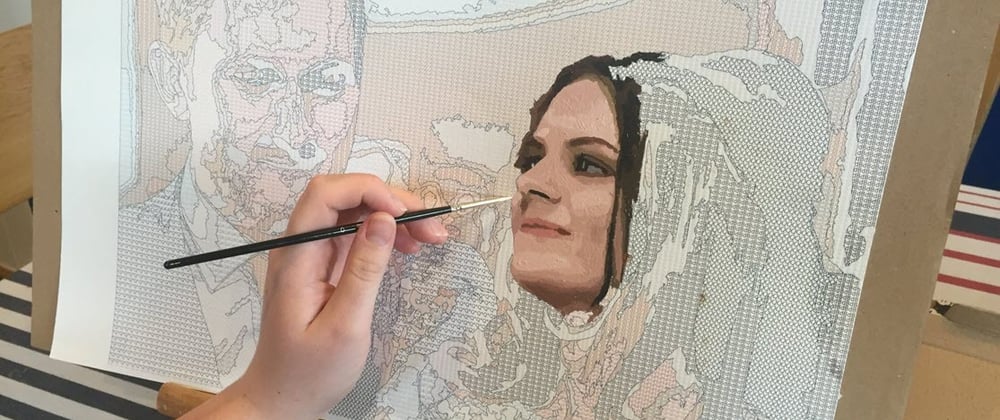
Finally, just because you use a color map/grid to do your work doesn't mean that you're limited to cranking out tightly-defined pixelated art. For example, the current piece that I'm working on uses an image processed through my software as a reference. But the paint that I'm laying down looks like this:
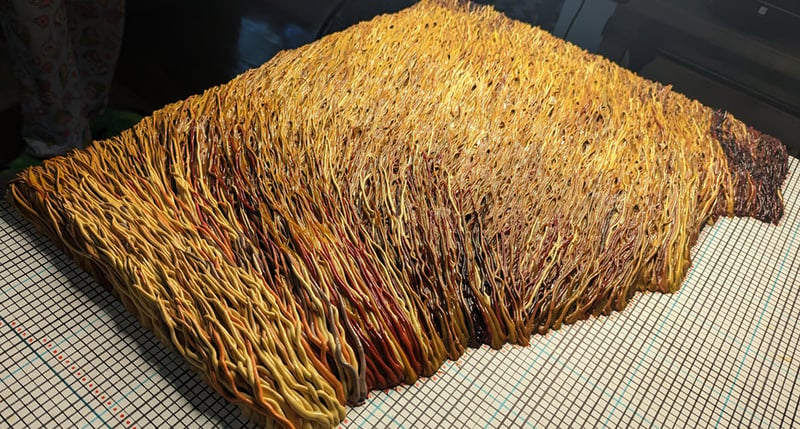
That's hardly what most people would call "pixelated". You see, I only use the color map as a means to guide me as to where each color should start. But that doesn't mean that every blob of paint is strictly confined to it's original coordinate.
In the next installment...
There is no next installment! Whew! That was a lot to write! I don't know how many people here it will help (if any). But I wanted to document many of the things that I learned about color management in React/JavaScript. Dealing with colors is a lot more nuanced than I ever believed when I first started down this path.
Building Paint Map Studio was an immensely fun experience. Not only does it serve as a practical tool in my painting, but it's vastly expanded my ability to programmatically manipulate images and dynamically manage aspects of color within those images.
Thank you for reading!