NodeJs was released almost 9 years ago. The default debugging process of NodeJs (read Node.js) is quite clumsy. You are already aware of the need to add --inspect to the node script with node inspector. It is also dependent on chrome. Then look at the proper web socket connection which is hard and debug using chrome node debugger. To be honest, it is a pain in the neck.
Finally, Google chromelabs has released ndb, which they say is “An improved debugging experience for Node.js, enabled by Chrome DevTools”. Ndb is a boon to debug a nodejs app.
I am going to show a step by step process of debugging nodejs application with ndb. In other words, you will learn how to debug a nodejs application using ndb. Below you can see ndb in action, let’s roll up your sleeves and get started:
Prerequisites
Below are some prerequisites before you get started:
You have nodejs installed on your system (a no-brainer but still worth a mention)
You have general knowledge of running node scripts and working with nodejs apps.
You have prior debugging experience with nodejs or any other language.
For debugging nodejs application in place of just another script I will use a full nodejs express application. It is an open source application I used for a demo on testing nodejs application.
Debugging nodejs express application as a demo
I am using my opensource currency API for this step-by-step getting started of debugging a nodejs application. It is built using express js framework. You can also check the running app hosted on Zeit Now to see the USD to AUD rate of 2019–01–10 as an example.
The idea of the application is simple. If the conversion rate is available in the database it will fetch it from the database. If not it will fetch it from another API and send it back to the user also saving the rate in the database at the same time (async) for later use.
You can clone the application from github and run npm install to get it ready for debugging. This is a very simple application with most of the logic in exchangeRates.js file. It has mocha tests too as it was a demo for testing nodejs application.
1. Getting started, install ndb
Installing ndb is very easy. All you need to do to get started with debugging your nodejs application is to install ndb. I would suggest to install it globally with:
# with npm
npm install -g ndb

#with yarn
yarn global add ndb
You can also install and use it locally per app if you want. One thing I had to fix was to get the latest version of chrome as I saw some permission issues.
2. Run the app with ndb (not node or nodemon)
For debugging nodejs applications with ndb you can directly run the nodejs app script with ndb rather than node. For example, if you were used to doing node index.js or nodemon index.js in development. To debug your app you can run:
Notice that you don’t need to put any -- inspect so the experience is a lot smoother.
You don’t need to remember a different port or go to chrome devtools and open up a different inspector window to debug. Such a relief!
ndb opens up a screen like below when you do ndb . or ndb index.js:
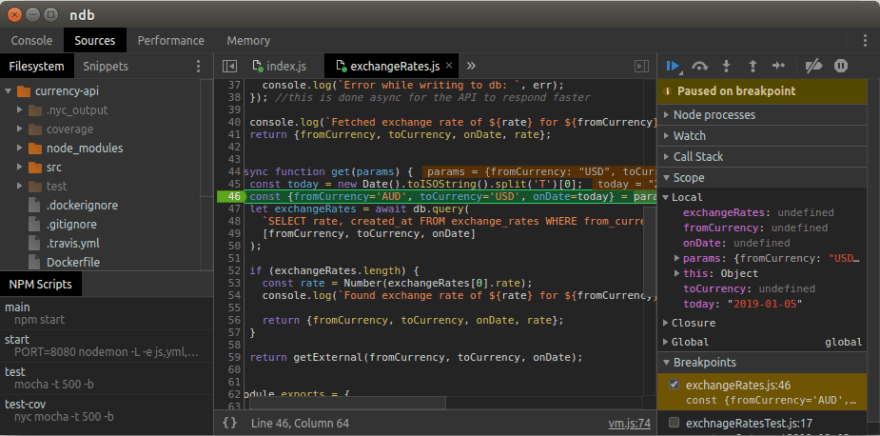
Please add a breakpoint on line 46. As you have run the application with ndb it will run in debug mode and stop at the breakpoint like below when you hit http://localhost:8080/api/convert/USD/AUD/2019-01-01 on the browser. I have set the breakpoint on exchangeRates.js like 46 in the screenshot below:
ndb allows you to run any script for debugging. For example, I can run ndb npm start and it will use the nodemon run. This means I can debug the application while changing the code which is great.
As an example it can be run with ndb npm start to debug this nodejs express application.
You can also debug your test with a command like ndb npm test.
3. Let’s debug some code
As the debugger is working I can place more break points or run through the code at my speed and convenience.
The essential shortcuts are F10 to step over function call and F11 to step into a function.
The usual debugging workflow I assume you are familiar with. below I have advanced to line 52:
More debugging things
As any other debugger with ndb you can:
Add watches
Check the call stack trace
-
Check the process
The console tab is also helpful if you want to some quick nodejs code in the context.
Read more about what you can do with ndb in the official readme. Below is a screenshot of the useful console:
Conclusion (TLDR)
Debugging any nodejs application with ndb is a better developer experience. To debug the currency API nodejs express app with ndb you run do the following commands give you have node > 8 installed:
npm install -g ndb
git clone [email protected]:geshan/currency-api.git
cd currency-api
npm install
ndb npm start
After the ndb debugger opens up add a breakpoint at line 46 of src/exchangeRates.js
Then open http://localhost:8080/api/convert/USD/AUD/2019-01-01 in the browser
Now as the app should pause at the breakpoint, Enjoy! and continue debugging.
If it works for this app, you can debug any of your nodejs application with this approach.
Welcome to the new way of debugging nodejs application that is browser independent and a lot more smoother than the default experience. Step up your debugging nodejs application game.
I hope this post has helped you debug your nodejs application better. If you have any other things to share about debugging nodejs apps or better usage of ndb please comment below!
Originally published at geshan.com.np.


