
(this article originally appeared on AdatoSystems.com)
While a lot of my inspiration for blog posts come from talking with New Relic users, it's hard to share them as examples because their so specific and often confidential. So I find myself struggling more to find a generic "for instance" that's easy to understand and accessible to all everyone.
Which should explain why I use my home environment as the sample use case so often. Even if you don't have exactly the same gear or setup I do, it's likely you have something analogous. On top of that, if you don't have the specific element I'm discussing, many times I believe it's something you ought to consider.
That brings us to my example today: Pi-Hole. Pi-Hole acts as a first-level DNS server for your network. But what it REALLY does is make your network faster and safer by blocking requests to malicious, unsavory, or just plain obnoxious sites. If you’re using Pi-Hole, it’ll be most noticeable in the ways advertisements on a webpage load:
BEFORE: pop-overs and hyperbolic ads.

AFTER: No pop-overs, spam ads blocked

But under the hood, it’s even more significant:
BEFORE: 45 seconds to load
AFTER: 6 seconds to load
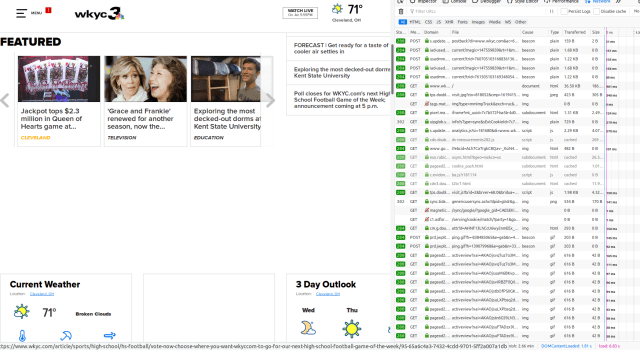
Look in the lower-right corner of each of those images. Load time without Pi-Hole was over 45 seconds. With it, the load time was 6 seconds.
You may there are many pages like this, but the truth is web pages link to these sites all the time. Here's the statistics from my house on a typical day.

How Does the Pi-Hole API Work?
If you have Pi-Hole running, you get to the API by going to http://<your pi-hole url>/admin/api.php?summaryRaw.
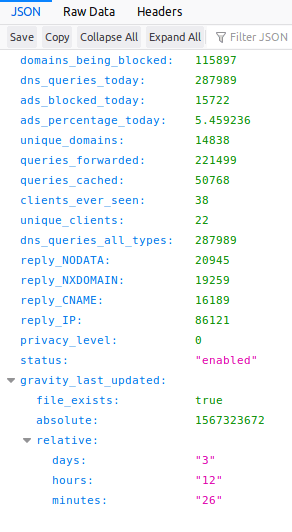
The result will look something like this:
{”domains_being_blocked”:115897,”dns_queries_today”:284514,”ads_blocked_today”:17865,”ads_percentage_today”:6.279129,”unique_domains”:14761,”queries_forwarded”:216109,”queries_cached”:50540,”clients_ever_seen”:38,”unique_clients”:22,”dns_queries_all_types”:284514,”reply_NODATA”:20262,”reply_NXDOMAIN”:19114,”reply_CNAME”:16364,”reply_IP”:87029,”privacy_level”:0,”status”:”enabled,””gravity_last_updated”:{”file_exists”:true,”absolute”:1567323672,”relative”:{”days”:”3,””hours”:”09,””minutes”:”53”}}}
Let's format the JSON data so it looks a little prettier:
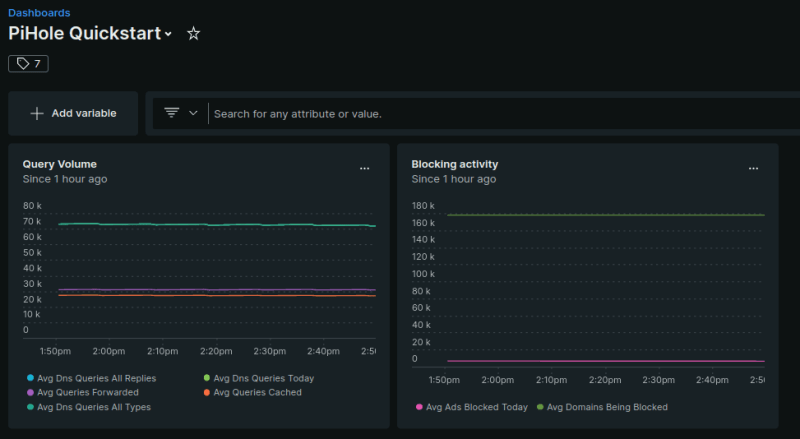
The point is, once we have access to all that JSON-y goodness, it's almost trivial (using the Flex integration, which I discussed in this series ) to collect and send into New Relic, to provide further insight into how your network is performing. At that point, you can start to include the information in graphs like this:
Assuming you have the New Relic infrastructure agent installed on on any system on the network that can access your pihole (and once again, if you need help getting that set up, check out my earlier blog post here) you have relatively few steps to get up and running.
First, the YAML file would look like this (you can also find it on the New Relic Flex github repo in the examples folder.
integrations:
  - name: nri-flex
    config:
      name: pihole_simple
      apis:
        - name: pihole_simple
          url: http://pi.hole/admin/api.php?summaryRaw&auth= #<your API Key Here>
          headers:
            accept: application/json
      remove_keys:
        - timestamp
Next, the NRQL you'd need to set up two different charts are as follows:
For the "Query Volume" chart:
From pihole_simpleSample SELECT average(dns_queries_all_replies), average(dns_queries_today), average(queries_forwarded), average(queries_cached), average(dns_queries_all_types) TIMESERIES
For the "Blocking Activity" chart:
From pihole_simpleSample SELECT average(ads_blocked_today), average(domains_being_blocked) TIMESERIES
This is, of course, only the start of the insights you can gain from your Pi-Hole server (and by extension, ANY device or service that has an API with endpoints that provide data). If you find additional use cases, feel free to reach out to me in the comments below, on social media, or when you see me at a conference or meet-up.


