Large language models (LLMs) have become increasingly powerful and capable. These models can be used for a variety of tasks, including generating text, translating languages, and answering questions.
Langchain is a Python module that makes it easier to use LLMs. Langchain provides a standard interface for accessing LLMs, and it supports a variety of LLMs, including GPT-3, LLama, and GPT4All.
In this article, I will show how to use Langchain to analyze CSV files. We will use the OpenAI API to access GPT-3, and Streamlit to create a user interface. The user will be able to upload a CSV file and ask questions about the data. The system will then generate answers, and it can also draw tables and graphs.
Getting started
To get started, you will need to install langchain, openai, streamlit and python-environ. You can install them with pip:
pip install langchain openai streamlit python-environ tabulate
Setting up the agent
I have included all the code for this project on my github.
Setting up the agent is fairly straightforward as we're going to be using the create_pandas_dataframe_agent that comes with langchain. For those who might not be familiar, an agent is is a software program that can access and use a large language model (LLM). Agents are responsible for taking user input, processing it, and generating a response. They can also access and process data from other sources, such as databases, APIs and in this case, a csv file.
We are going to use the python-environ module to manage the API key.
Create a .env file and add the keys into it as below:
apikey=your_openai_api_key
Create a file named agent.py and add the following code:
# agent.py
from langchain import OpenAI
from langchain.agents import create_pandas_dataframe_agent
import pandas as pd

# Setting up the api key
import environ

env = environ.Env()
environ.Env.read_env()

API_KEY = env("apikey")


def create_agent(filename: str):
    """
    Create an agent that can access and use a large language model (LLM).

    Args:
        filename: The path to the CSV file that contains the data.

    Returns:
        An agent that can access and use the LLM.
    """

    # Create an OpenAI object.
    llm = OpenAI(openai_api_key=API_KEY)

    # Read the CSV file into a Pandas DataFrame.
    df = pd.read_csv(filename)

    # Create a Pandas DataFrame agent.
    return create_pandas_dataframe_agent(llm, df, verbose=False)
The create_agent function takes a path to a CSV file as input and returns an agent that can access and use a large language model (LLM). The function first creates an OpenAI object and then reads the CSV file into a Pandas DataFrame. Finally, it creates a Pandas DataFrame agent and returns it.
Now add the following function to agent.py:
#agent.py

# ...

def query_agent(agent, query):
    """
    Query an agent and return the response as a string.

    Args:
        agent: The agent to query.
        query: The query to ask the agent.

    Returns:
        The response from the agent as a string.
    """

    prompt = (
        """
            For the following query, if it requires drawing a table, reply as follows:
            {"table": {"columns": ["column1", "column2", ...], "data": [[value1, value2, ...], [value1, value2, ...], ...]}}

            If the query requires creating a bar chart, reply as follows:
            {"bar": {"columns": ["A", "B", "C", ...], "data": [25, 24, 10, ...]}}

            If the query requires creating a line chart, reply as follows:
            {"line": {"columns": ["A", "B", "C", ...], "data": [25, 24, 10, ...]}}

            There can only be two types of chart, "bar" and "line".

            If it is just asking a question that requires neither, reply as follows:
            {"answer": "answer"}
            Example:
            {"answer": "The title with the highest rating is 'Gilead'"}

            If you do not know the answer, reply as follows:
            {"answer": "I do not know."}

            Return all output as a string.

            All strings in "columns" list and data list, should be in double quotes,

            For example: {"columns": ["title", "ratings_count"], "data": [["Gilead", 361], ["Spider's Web", 5164]]}

            Lets think step by step.

            Below is the query.
            Query:
            """
        + query
    )

    # Run the prompt through the agent.
    response = agent.run(prompt)

    # Convert the response to a string.
    return response.__str__()
The query_agent function is where all the magic happens. This function takes an agent(pandas dataframe agent) and a query as input and returns the response from the agent as a string. The function first creates a prompt for the agent. In this prompt we specify the kind of responses we want. I want the agent to return a string that will later be converted to a dictionary and based on the contents of that dictionary, the program will either render a graph, a table or a simple text response.
Setting up the streamlit interface
Streamlit is an open-source Python library that makes it easy to create web apps for machine learning and data science. Streamlit is designed to be quick and easy to use, and it can be used to create beautiful, interactive apps without any JavaScript or CSS knowledge. For more information, you can check out the documentation.
Streamlit is fairly easy to use. Create a file named interface.py and add the following:
import streamlit as st
import pandas as pd
import json

from agent import query_agent, create_agent


def decode_response(response: str) -> dict:
    """This function converts the string response from the model to a dictionary object.

    Args:
        response (str): response from the model

    Returns:
        dict: dictionary with response data
    """
    return json.loads(response)
The decode_response function is simply going to convert the response from the agent which is a string to a dictionary.
Add the following code to interface.py:
#interface.py

#...

def write_response(response_dict: dict):
    """
    Write a response from an agent to a Streamlit app.

    Args:
        response_dict: The response from the agent.

    Returns:
        None.
    """

    # Check if the response is an answer.
    if "answer" in response_dict:
        st.write(response_dict["answer"])

    # Check if the response is a bar chart.
    if "bar" in response_dict:
        data = response_dict["bar"]
        df = pd.DataFrame(data)
        df.set_index("columns", inplace=True)
        st.bar_chart(df)

    # Check if the response is a line chart.
    if "line" in response_dict:
        data = response_dict["line"]
        df = pd.DataFrame(data)
        df.set_index("columns", inplace=True)
        st.line_chart(df)

    # Check if the response is a table.
    if "table" in response_dict:
        data = response_dict["table"]
        df = pd.DataFrame(data["data"], columns=data["columns"])
        st.table(df)
This function takes a response dictionary as input and writes the response to the Streamlit app. It can be used to write answers, bar charts, line charts, and tables to the app.
It first checks if the response is an 'answer', that is if it is just a normal text response for questions like 'How many rows are in the document?'. If it is, the function writes the answer to the app.
The function then checks if the response is for a bar chart. If it is, the function creates a bar chart from the data in the response and writes the chart to the app.
The function then checks if the response is for a line chart. If it is, the function creates a line chart from the data in the response and writes the chart to the app.
The function then checks if the response is a table. If it is, the function creates a table from the data in the response and writes the table to the app.
Finally we'll create the initial interface. Add the following lines:
#interface.py
#...
st.title("👨💻 Chat with your CSV")
st.write("Please upload your CSV file below.")
data = st.file_uploader("Upload a CSV")
query = st.text_area("Insert your query")
if st.button("Submit Query", type="primary"):
# Create an agent from the CSV file.
agent = create_agent(data)
# Query the agent.
response = query_agent(agent=agent, query=query)
# Decode the response.
decoded_response = decode_response(response)
# Write the response to the Streamlit app.
write_response(decoded_response)
This code creates a Streamlit app that allows users to chat with their CSV files. The app first asks the user to upload a CSV file. The app then asks the user to enter a query. If the user clicks the "Submit Query" button, the app will query the agent and write the response to the app.
The app uses the following functions:
-
create_agent(): This function creates an agent from a CSV file. -
query_agent(): This function queries an agent and returns the response. -
decode_response(): This function decodes a response from an agent. -
write_response(): This function writes a response to a Streamlit app.
Lets try it out!
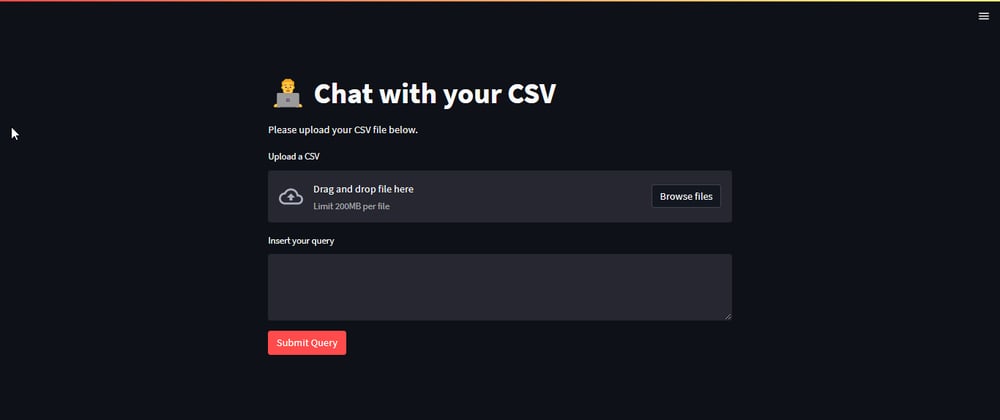
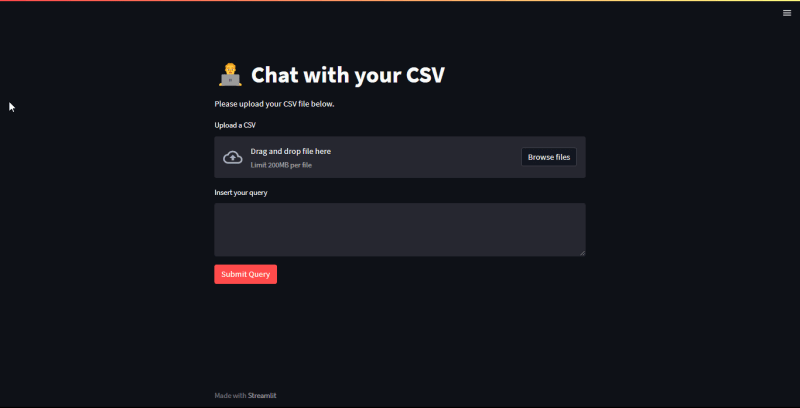
Now in the console, start the application with streamlit run interface.py. This should open up a window in your browser that looks as follows:
For this tutorial, I'll be using data on books that can be found on kaggle. Upload your csv and let the prompting begin!
First query: Which book has the highest rating count?
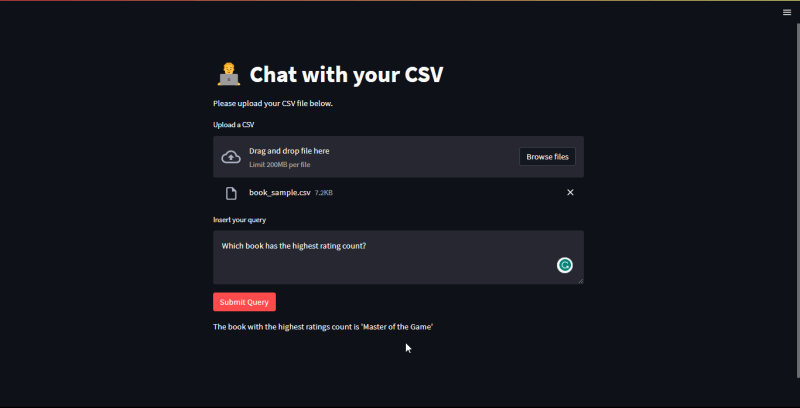
Apparently Master of the game has the highest rating count, guess I should read it.
Second query: Tabulate the first 5 books. Include the title and the rating count columns only.

Note: I limited the columns to the title and rating columns so that we don't exceed the API token limitation.
Third query: Create a bar graph on the first 5 books
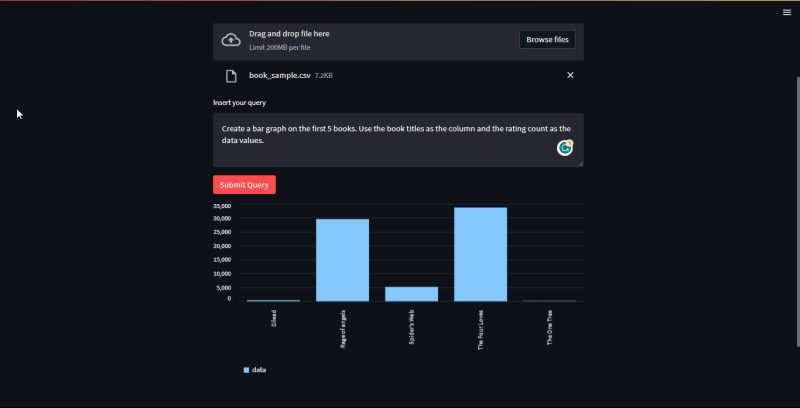
The above query will generate a bar graph. I specified the columns I want it to use to make easier for the model to understand my query. Pretty neat.
Forth query: Create a line graph of the first 5 books
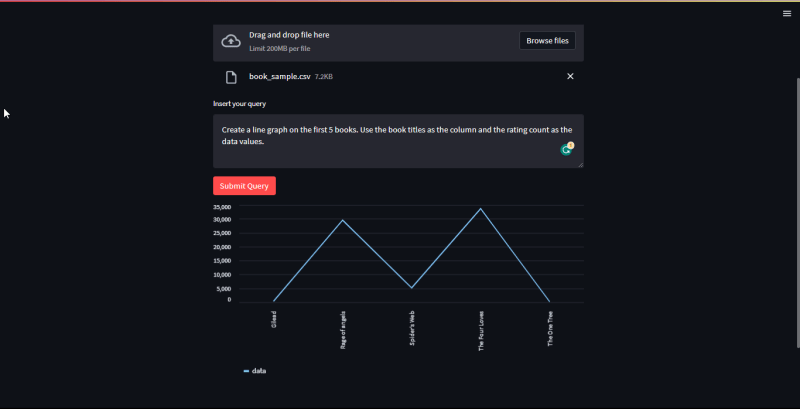
In conclusion, Langchain and streamlit are powerful tools that can be used to make it easy for members to ask the LLMs about their data. The application allows them to get visualizations. This can be a valuable resource for members who want to learn more about their data or who need help making sense of it.
If you have any questions, feel free to reach out!


