Google Sheets can be a handy tool for project management. I wanted to create this post to share a few tricks to build a Gantt chart in Sheets.
Note: This is based on a template I found in Sheets that I modified to be more dynamic.
1. The timeline

You probably already know that like most spreadsheet tools, Sheets has native date support. So you can enter text like "3/4/2019" and Sheets will understand it to mean March 4, 2019 (sorry non-Americans).
What you might not know is that you can apply arithmetic operations on a date, like adding days to a date. So for our timeline, we can start with a fixed date like March 4 and dynamically create the next week's date by adding 7 to it. In the example above, March 4 is in cell E3. So the next week's date will be in F3 and we can generate it by using the formula =E3+7. Copy F3, select the rest of the row, and select Edit > Paste special > Paste formula only to generate dates for rest of the timeline.

To get the dates to appear only as the day of the month, you can use custom date formatting. Select the timeline cells, go to Format > Number > More formats > More date and time formats..., and put only the "Day" chip in the form field.
2. The current week
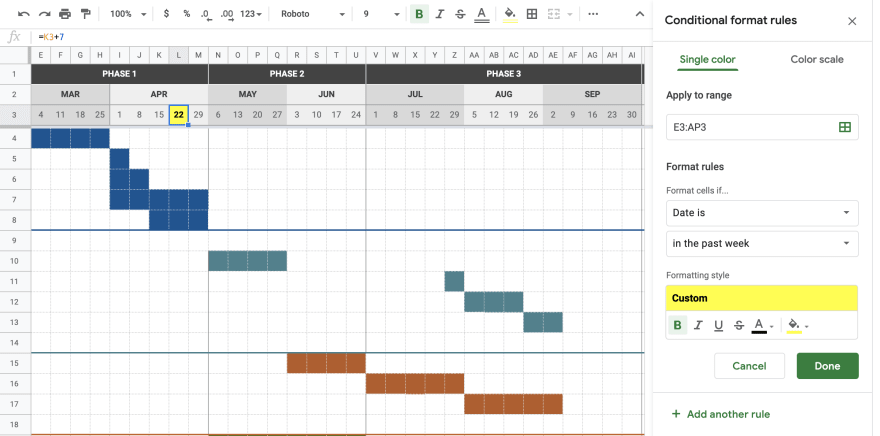
You'll notice in the previous screenshot that April 22 is highlighted in yellow. Today's date is April 25, so this is indicating that we're currently in the week of the 22nd.
This is done thanks to conditional formatting. The format rules include three date-related values: date is, date is before, and date is after. So Sheets can dynamically change the background color of the cell when its date value is in the past 7 days.
To create this rule, select all cells in the timeline row, go to Format > Conditional formatting..., and set the rule to "Date is in the past week". In my case, I applied bold weight and yellow background color formatting.
So every time you open the sheet, it should be obvious what the deadlines are for the current week.
3. Project grid
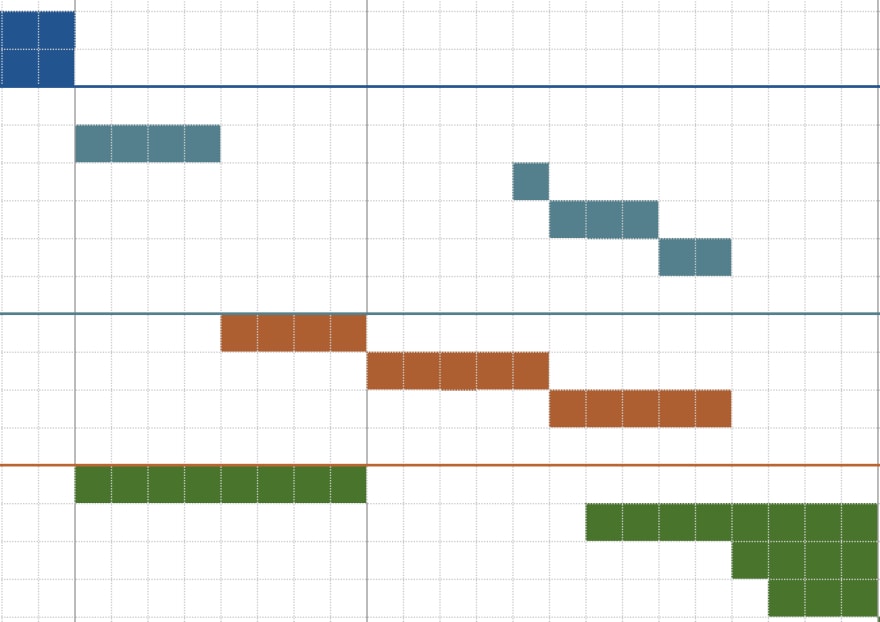
This is more of a quick tip, but getting the project grid to consist of squares might be tedious if you're doing each row and column manually.
To set the rows and columns to exactly the same height/width, first select the all of the columns, right click, select Resize columns..., and enter the column width in pixels. I'm using 26px. Then repeat for all of the rows. They don't need to be perfect squares, as long as all rows are the same height and all columns are the same width.
The rest of the magic is to apply border and background styles to make the cells appear like blocks in the waterfall chart. This can be tedious, but copying cells and selecting Edit > Paste special... > Paste format only can be a helpful way of repeating the same styles across many cells.
If you want to make a copy of my sheet as a starting point, you can find it here. Hope you found this useful!