The Chrome UX Report (CrUX) is a dataset of real Chrome users' performance browsing 5+ million websites. This week in its latest release, Time to First Byte (TTFB) was added as a new metric. TTFB is a measure of how long the web page took from the start of navigation (clicking a link) to the first byte of the response arriving to the client. There's a lot that happens in between there, from DNS resolution and SSL negotiation, to server-side rendering and database lookups. Both network and server response times are critical for web performance because they delay the first byte of the response. All of this must happen before the website ships megabytes of images and JavaScript, which slow down the loading experience even more. So if the TTFB isn't fast, no amount of front end optimization has a chance at providing a fast experience to users. This makes it a great metric to measure hosting providers.
I've shared this data with a number of people already, and a lot of the time their first reaction is to roll their eyes as if to say "not another TTFB study". But this is not like other TTFB studies. The Chrome UX Report is the only dataset of its kind (that I know of) to report on real user experiences as opposed to lab-based testing. This makes it uniquely equipped to answer age-old questions like "How fast is a given website?" because its methodology is based on how users actually experience the performance.
Today I'm releasing a new study called Is my host fast yet? a leaderboard of host performance using the CrUX dataset. It also leverages the HTTP Archive dataset to identify websites' hosts by looking for their signatures in response headers. For example, some hosts self-identify in the X-Powered-By header.
The way it works is by querying the datasets together on BigQuery, aggregating the number of websites for each host, and their distributions of TTFB performance:
#standardSQL
SELECT
  CASE
   WHEN platform = 'seravo' THEN 'Seravo'
   WHEN platform = 'automattic.com/jobs' THEN 'Automattic'
   WHEN platform = 'x-ah-environment' THEN 'Acquia'
   WHEN platform = 'x-pantheon-styx-hostname' THEN 'Pantheon'
   WHEN platform = 'wpe-backend' THEN 'WP Engine'
   WHEN platform = 'x-kinsta-cache' THEN 'Kinsta'
   WHEN platform = 'hubspot' THEN 'HubSpot'
   WHEN platform = '192fc2e7e50945beb8231a492d6a8024' THEN 'Siteground'
   WHEN platform = 'x-github-request' THEN 'GitHub'
   WHEN platform = 'alproxy' THEN 'AlwaysData'
   ELSE NULL
  END AS platform,
  client,
  COUNT(DISTINCT origin) AS n,
  SUM(IF(ttfb.start < 200, ttfb.density, 0)) / SUM(ttfb.density) AS fast,
  SUM(IF(ttfb.start >= 200 AND ttfb.start < 1000, ttfb.density, 0)) / SUM(ttfb.density) AS avg,
  SUM(IF(ttfb.start >= 1000, ttfb.density, 0)) / SUM(ttfb.density) AS slow
FROM
  `chrome-ux-report.all.201906`,
  UNNEST(experimental.time_to_first_byte.histogram.bin) AS ttfb
JOIN
  (SELECT _TABLE_SUFFIX AS client, url, REGEXP_EXTRACT(LOWER(CONCAT(respOtherHeaders, resp_x_powered_by, resp_via)),
      '(seravo|x-kinsta-cache|automattic.com/jobs|x-ah-environment|x-pantheon-styx-hostname|wpe-backend|hubspot|192fc2e7e50945beb8231a492d6a8024|x-github-request|alproxy)')
    AS platform
  FROM `httparchive.summary_requests.2019_06_01_*`)
ON
  client = IF(form_factor.name = 'desktop', 'desktop', 'mobile') AND
  CONCAT(origin, '/') = url
WHERE
  platform IS NOT NULL
GROUP BY
  platform,
  client
ORDER BY
  n DESC
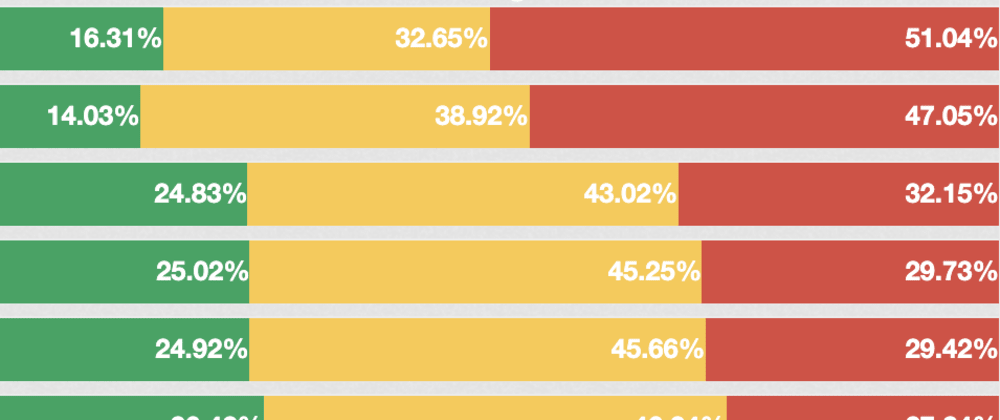
The website renders the results in order of fast TTFB performance:

The datasets update monthly, so we'll be able to track how hosts improve (or not) over time. It's also easy to add new hosts, so please contribute if you know how to detect anything we're missing.


