Data analysis is a critical aspect that enables businesses to make informed decisions. The ability to visualize and analyze data in real-time is a game-changer, and Cumulocity IoT offers a variety of widgets to facilitate this. In this article, we will explore four open-source widgets that are designed to enhance data analysis capabilities in Cumulocity IoT. These widgets are available on GitHub and can be integrated into your Cumulocity IoT applications.
Bar Chart Widget Plugin
Author: @Meer_Arfath
The Bar Chart Widget Plugin is a Cumulocity IoT module federation plugin created using c8ycli. This plugin can be used in the Application Builder or Cockpit.
The Bar Chart Widget allows you to define multiple datapoints as constant values or realtime measurements from a device or device group. Created by Global Presales.
Bar Chart widget for Cumulocity 
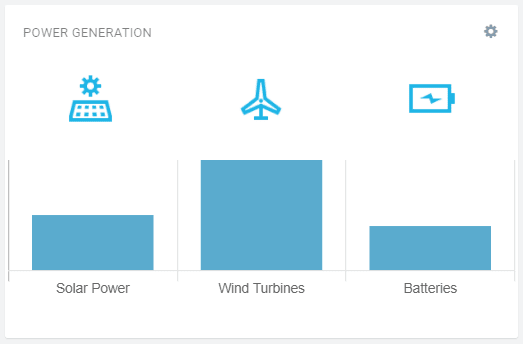
The Bar Chart widget is the Cumulocity module federation plugin created using c8ycli. This plugin can be used in Application Builder or Cockpit. The Bar Chart widget allows you to define multiple datapoints as constant (fixed) values or actual measurement values in realtime from Device or Device Groups. In addition, you can add custom icon respective to each datapoint.
Please choose Bar Chart release based on Cumulocity/Application builder version:
| APPLICATION BUILDER |
CUMULOCITY |
BAR CHART WIDGET |
| 2.0.x |
>= 1016.x.x |
1.x.x |

Prerequisite
Cumulocity c8ycli >=1016.x.x
Installation
Runtime Widget Deployment?
- This widget support runtime deployment. Download Runtime Binary and install via Administrations --> Ecosystems --> Applications --> Packages.
QuickStart
This guide will teach you how to add widget in your existing or new dashboard.
-
Open you application from App Switcher
-
Add new dashboard or navigate to existing dashboard
-
Click Add Widget
-
Search for Bar Chart
-
Select Target Assets…
The Bar Chart widget allows you to define multiple datapoints as constant (fixed) values or actual measurement values in real time from Device or Device Groups. In addition, you can add custom icons respective to each datapoint. This feature allows for a more personalized and visually appealing representation of your data.
Event Chart Widget Plugin
Author: @Ravi_Shankar_Kumar
The Event Chart Widget Plugin is a Cumulocity IoT module federation plugin created using c8ycli. This plugin can be used in the Application Builder or Cockpit. This widget helps you display the chart for a specific event type, grouping the events based on the entered group by parameter and displaying the count for each group by the parameter value.
The Event Chart widget is designed to display the chart for the specific event type. It groups the events based on the entered group by parameter and displays the count for each group by the parameter value. Created by Global Presales.
Event Chart Widget for Cumulocity
This Event Chart widget is the Cumulocity module federation plugin created using c8ycli. This plugin can be used in Application Builder or Cockpit
The Event Chart widget help you to display the chart for the specific event type. It groups the events based on the entered group by parameter and displays the count for each group by the parameter value.
Please choose Event Chart release based on Cumulocity/Application builder version:
| APPLICATION BUILDER |
CUMULOCITY |
EVENT CHART WIDGET |
| 2.0.x |
>=1016.x.x |
1.x.x |
The charts available include
-
Vertical Bar Chart
-
Horizontal Bar Chart
-
Donut Chart
-
Pie Chart
-
Radar Chart
-
Polar Chart
-
Stack Chart
The widget also comes with an inbuilt color picker, which helps one to customize chart/border colors.

Features
-
Support single device and group devices: Based on widget configuration.
-
Supports Event Chart: It displays the Event chart for the selected Event Type and group by parameter in configuration.
- …
The widget supports various chart types, including vertical bar chart, horizontal bar chart, donut chart, pie chart, radar chart, polar chart, and stack chart. It also supports grouped charts and stack charts based on the filter type selected in the configuration. The widget also comes with an inbuilt color picker, which helps you customize chart/border colors.

Processing Widget Plugin
Author: @sandhya.m
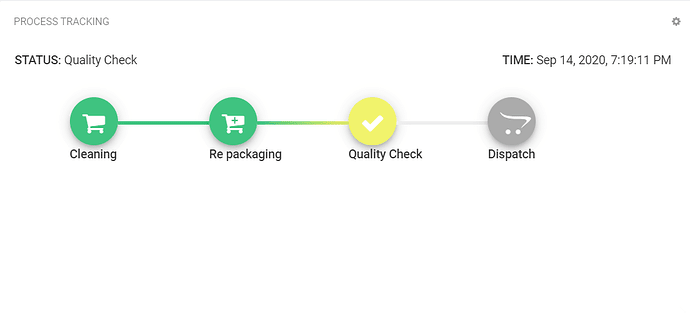
The Processing Widget Plugin is a Cumulocity IoT module federation plugin created using c8ycli. This plugin can be used in the Application Builder or Cockpit. The Processing Widget is designed to display the current process state based on the latest event, updating the state whenever a new event is received.
The Processing Widgets displays the current process state based on the latest event. Updates the state whenever a new event is subscribed.Created by Global Presales.
Processing Widget Plugin for Cumulocity
This is the Cumulocity module federation plugin created using c8ycli. This plugin can be used in Application Builder or Cockpit. The Processing Widget is designed to display the current process state based on the latest event. Updates the state whenever a new event is received.
To deliver the expected functionality one need to set/select the following configuration parameters:
- Event Type(required)
- Device/Group (select)
- Field Name(required)
- Display Status for each state (atleast 1)
- Field value for each state (atleast 1)
- mat-icon name for each state(select)
- Include child devices - You can toggle the slider if you want the results for child devices also.
Please choose Processing Widget release based on Cumulocity/Application builder version:
| APPLICATION BUILDER |
CUMULOCITY |
PROCESSING WIDGET |
| 2.0.x |
>= 1016.x.x |
1.x.x |

Features
-
Support single device and group devices: Based on widget configuration.
-
Display realtime process update: whenever a new event is triggered it updates the state…
The widget supports both single devices and group devices, and it displays real-time process updates. Whenever a new event is triggered, it updates the state based on the field value. It also displays the current state of the process based on the last event status.
Event Graph Widget Plugin
Author: @Hendrik_Naether1
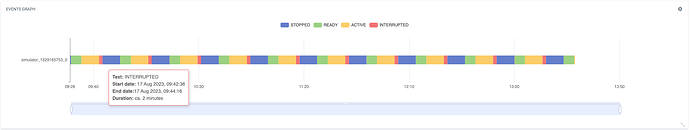
This Cumulocity IoT Event Graph Widget Plugin displays an event occurrence in a timeline chart, using echarts profiling example approach.
The Event Graph Widget Plugin displays event occurrence in a timeline chart, using echarts profiling example approach. For the different texts a color can be chosen. (Currently only works in a device dashboard!)
IoT Cumulocity Events Graph package
Events Graph widget plugin
Show event occurence in a timeline chart, using echarts profiling example approach (see https://echarts.apache.org/examples/en/editor.html?c=custom-profile). For the different texts a color can be chosen. (Currently only works in a device dashboard!)
Features
Shows "duration" of every event by assuming that a state is finished once the next state starts - an event always ends with the submission of the next event. The chart shows a view of the past x hours and helps visualizing the state changes for a specific event type.
- choose color for different states
- select timeframe (max. 24 hours in the past)
- states can be deselected in the legend
- chart is zoomable
Sample images
Easily check which events occured when

The chart can be zoomed

Interactive legend

Limitations
- only works for single devices
- only works for single event type, visualising the different event texts as bars
- no realtime
- …
The widget shows the “duration” of every event by assuming that a state is finished once the next state starts - an event always ends with the submission of the next event. The chart shows a view of the past x hours and helps visualize the state changes for a specific event type.
Additional information
Each widget is provided as-is and without warranty or support. They do not constitute part of the Software AG product suite. Users are free to use, fork, and modify them, subject to the license agreement. While Software AG welcomes contributions, it cannot guarantee to include every contribution in the master project.
Relevant articles
Read full topic


