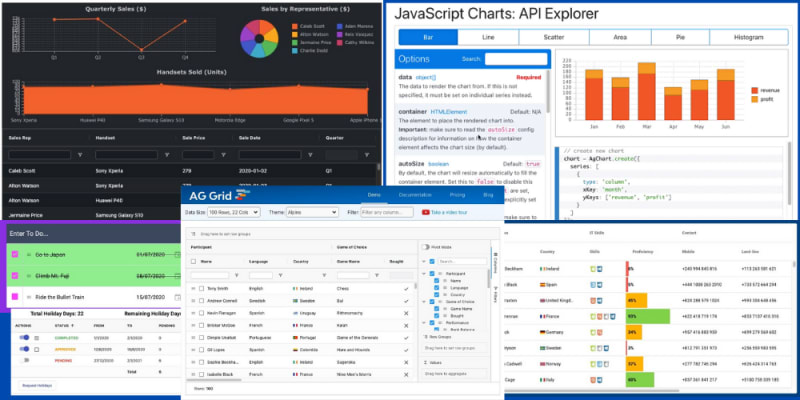
A small selection of sample applications and examples for AG Grid. Some created internally and some public examples found in the wild. All have live demos you can play with to see AG Grid in action.
Example Grids
This sample of grid examples from our site and documentation often show more features than are required in a live grid, but are useful for exploring the capabilities.
The Kitchen Sink Demo
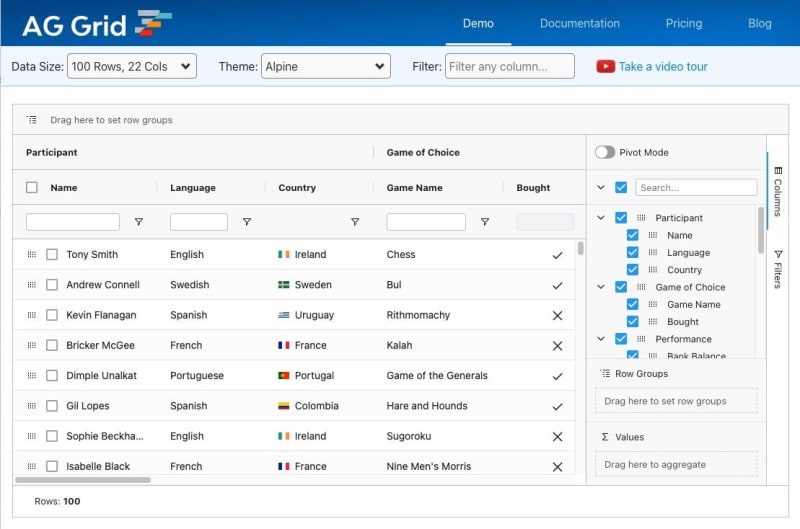
The main example used on the AG Grid site. It has as many features as possible activated to demonstrate the enterprise features: embedded charts, filtering, Excel and CSV export, custom menu items, pivot, custom cell renderers, quick filter, themes.
The First Example
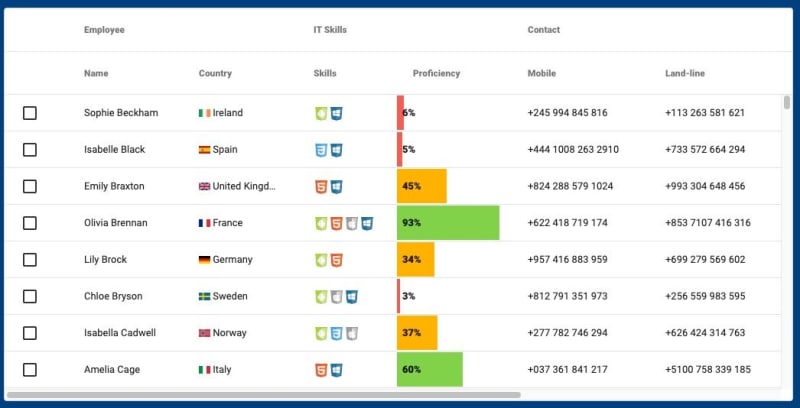
The first example on our website shows custom rendering of cells, row selection, column spanning in the header, sorting, filtering and other basic functions. We even hid an easter egg, view the page at less than 767 pixels and see what happens.
Application Created Integrated Charts
This example is also on our home page, but the version in the documentation for charts is editable so you can play with it and see how it works. The predefined chart in the example is updating at the same time as the data in the grid updates.
A Dashboard
We created three dashboard examples in the Integrated Charting documentation. The thumbnail highlights the Sales Dashboard example to provide an demo of the type of application page that might be present in an admin interface. Because we've linked to the documentation, you can edit the example and see how it works.
Third Party Library as Embedded Cell Renderer
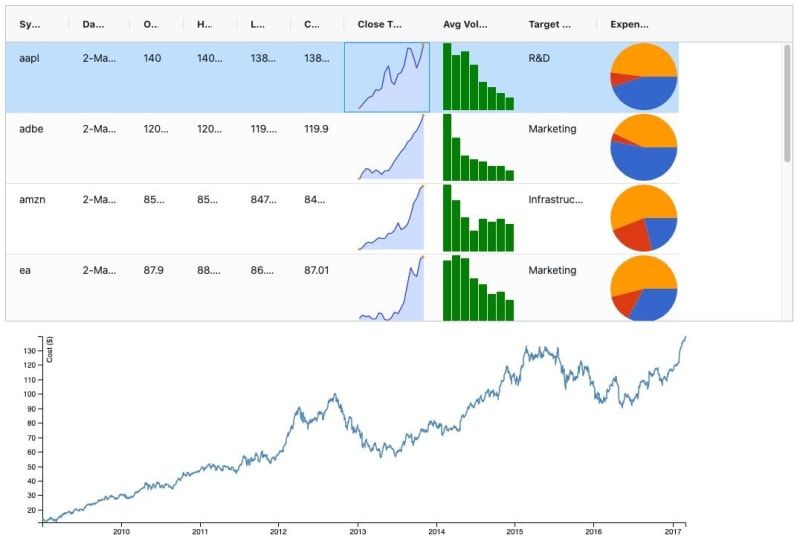
Even though we have our own charting library, we still support 3rd party libraries as custom renderers. You can add pretty much any library and use it to create the cell contents. The example chosen uses Sparklines for simple cell based charts.
Standalone Charts Explorer
Our own chart library has a lot of options and we have a separate gallery page in the documentation just for the chart library. Rather than showcase the gallery we are using the Charts API Explorer, and interactive page where you can amend the customisation and create different charts dynamically.
Blog Example Applications
Some of our blog posts have fairly complicated examples to support them, usually in the tutorials category. We've cherry picked a few below. Since they come with full source code you can expand them to add the missing features which is a great way to learn to work with existing grid application code.
Holiday Tracking App
The Holiday Tracking App from Shuheb in this 3rd Party DatePickers blog post doesn't just show 3rd party DatePickers, it also has Custom Cell Rendering on the Status and "Actions" field. Suggested improvements to try and implement are 'clear' the holidays to start a new year, and storing the holiday status to local storage.
TODO App
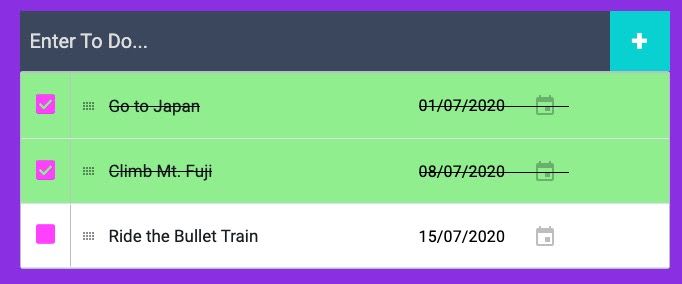
Putting to one side any discussion of Ahmed's chosen colour scheme, this Todo App written for the "Renderers as Editors" blog post is pretty good starting point for a todo app. Suggested next steps when playing with the code are: add local storage, filtering on done/not done, highlighting over-due tasks.
3rd Party Public Examples
Flight Fuel Consumption Tables
The Flight Fuel Consumptions Tables application shows up to date information of recent flights and their associated fuel consumption. Created by Pedro Despouy to bypass the 2 year delay in official Canadian emissions reporting. AG Grid is used to render the data and provide out of the box sorting and filter. Pedro has added custom cell rendering, data loading from API and 'on click' display of data in the text view.
Unavco Network Monitoring Map
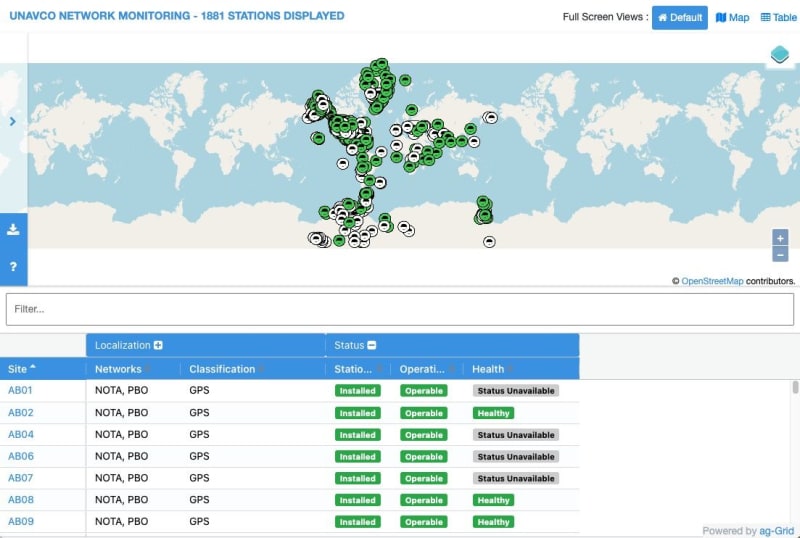
Unavco use AG Grid a part of their public Network Monitoring application. Combining a linked map view and grid view with custom cell renderers to make the data easy to understand at a glance and to click through for more information.
If you know of any public applications, or have written an application using AG Grid that we might be able to showcase then let us know info@ag-grid.com
