Automatizing a Postman test with JMeter
Noawadays, one of the most used tools to do functional testing against an API is Postman. Even though these can be automatized via command line with Newman, the most common use of this tool is to create manual tests during an API’s development.
When our server scales or we simply want to automatize our tests in a pipeline, Postman can prove quite challenging to use for our testing needs, specially if we also want to measure performance. Here is when Apache JMeter makes its entrance.
To summarize, Apache JMeter is an open source application designed to run functional tests against our system and measure its performance. This tool is pretty easy to use, really facilitating the automatization process and intuitively adding assertions to validate our API’s responses, both when these are positive or when we’re expecting an exception and/or an error message. Also, it allows a pretty smooth incorporation to our pipeline, since its dockerization is pretty simple.
Another JMeter benefit over Postman is that, aside from functional tests, it allows us to run performance and stress tests on multiple threads of execution over our application.
So, you might be considering adopting this tool, but right now all your functional tests are running on Postman? Migrating them one by one could indeed prove a daunting task. But that’s precisely what I’m about to show you next: an easy way to migrate Postman tests to JMeter so you can enjoy the benefits of using this tool.
Migrating from Postman to JMeter
The method we’re about to use to migrate our Postman tests to JMeter will use this last one as a proxy between Postman and our server or API. In this example we’ll be using the test migration between Postman and JMeter, but you can also assume that through this same method you can create tests from scratch with your own browser, intercepting the communications between your frontend and backend. For this example, we’ll be using JMeter version 5.0.
JMeter has a template and a guide on its own oficial documentation to create and use this method to intercept the communications between client and server. This template might generate files or tools that we might not need, so I’m going to show you a simple step by step process to create your JMeter test suite from scratch in an automatized manner.
In our example, we have a small user management repository, with some simple methods like a healthcheck, admin creation and sign in, user creation and sign in, etc. Also, we’ve created the calls to some of these endpoints on Postman:
We’ll focus on the healthcheck call for our example, since it’s the easiest one and our main interest is to show the interception process between client and server.
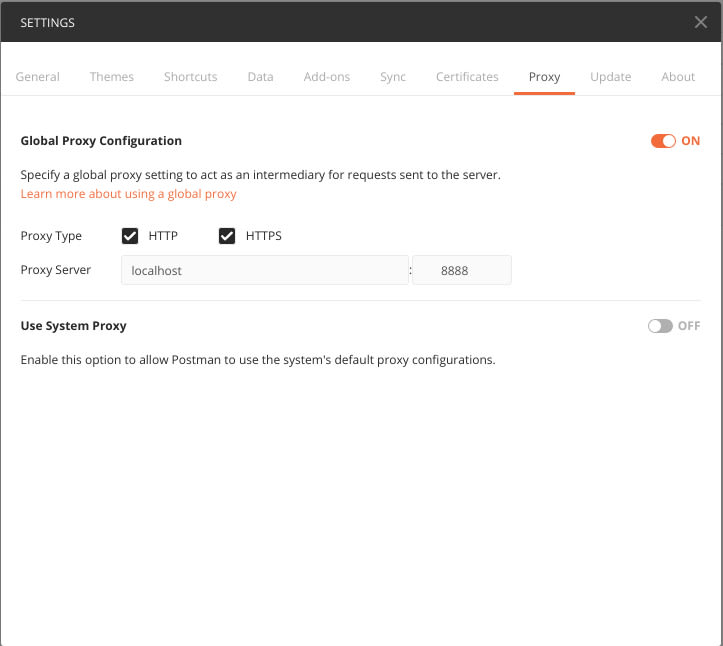
The first step will be to configure Postman so it points to the proxy. We’ll head to File -> Settings , and on the Proxy tab we’ll enable the Global Proxy Configuration option. We configure the Proxy type so it accepts HTTP and HTTPS , even though we’ll only be using a HTTP call. On Proxy Server we’ll point to l o c a l h o s t and set up the 8888 port for the proxy.
Once we’ve set up Postman, we’ll open JMeter with an empty Test Plan. On JMeter we’ll have two differentiated parts, one will be in charge of acting as a proxy and intercepting communications and the other one will be where we store the intercepted communications.
We’ll start with the second one. Once we’ve finished registering the intercepted communications, it will become our automatized functional test battery.
First, we’ll create a Thread Group. To do that, we right click over Test Plan and select Add -> Threads(Users) -> Thread Group.
Inside our Thread Group we’ll add Recording Controller : Add -> Logic Controller -> Recording Controller. This is where all the calls to our backend will appear, and will be our future tests.
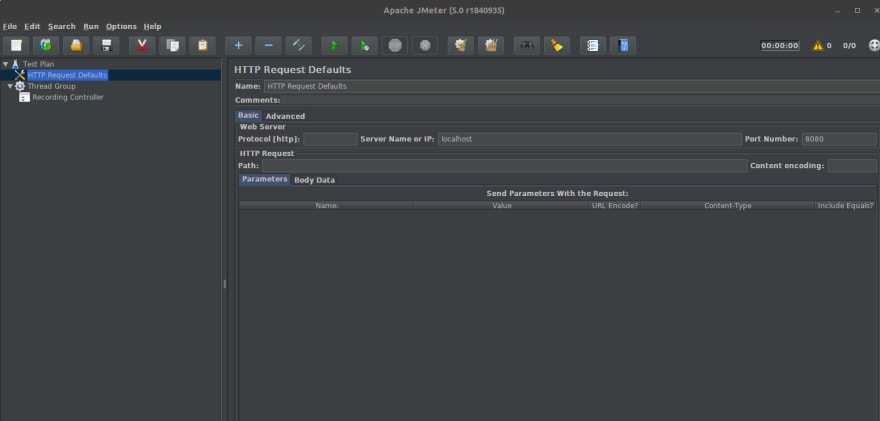
Lastly, we’ll a Http Request Defaults y Add -> Config Element -> HTTP Request Defaults ** to our **Test Plan. Here we’ll set up our backend’s url or IP.
Now that we’ve configured where the backend calls are going to be stored, it’s time to set up the call interception. To that end we’ll create a Proxy server on our Test Plan: Add -> Non-Test Elements -> HTTP Proxy Server (If you’re using an older version than JMeter5 there might be a section called WorkBench, and you’ll have to add it).
On the HTTP Proxy Server we’ll have to configure the Target Controller so it points towards our Recording Controller, and also set up the port to 8888 on Global Settings (it’s the port we’ve set up to point to Postman on the proxy’s configuration).
Pues bien, ya tenemos todo configurado para poder interceptar las llamadas entre nuestro cliente Postman y el servidor backend, solo nos falta darle a Start dentro de Test Script Recorder para empezar a grabar las llamadas en JMeter.
Everything’s set so we can intercept the calls between our Postman client and the backend server, all that’s left is to Start the Test Script Recorder to register the calls in JMeter.
Important consideration: When working on local environments, it’s pretty common to not add the “http” protocol on the client’s url; if we’re using a browser, it should automatically add it, but that’s not the case with Postman. If you don’t want any headache, don’t forget to add the protocol used to attack the backend to the URL, otherwise JMeter will miss the communication.
Time to test it: we press Start, go to Postman and run the call against the backend. If we go back to JMeter, we’ll see the call under Recording Controller, and inside of it we’ll find the headers used for the call.
Bonus Track: Checking the results
Once we have all the calls stored on JMeter, this gives us the chance to add checks to the responses so we don’t have to manually go over each one to check if its the expected result. In our example, the server answer to health is the word Green and a Status Code 200.
To automatize the stored tests we must create a View Result Tree inside the Thread Group ( Add -> Listeners -> View Result Tree ) to visualize the calls we’re going to run and their result.
At this point, all that’s left is to add the checks we want to add over the server’s responses. JMeter offers a lot of possibilities in order to verify the backend’s response, and for our example we’ll focus on the response’s answer body. Add a new assertion to the registered call by right clicking and doing Add -> Assertions -> Response Assertions.
Next, we’ll set up the Response Assertion to define the expected response on the response’s body: 1 – We select Field to Test as Test Response. 2 – Pattern Matching Rules as Equals. 3 – Patterns to Test , in our case, will be the text we’re expecting: Green.
And lastly, we execute these tests with the green Play symbol above. If everything goes according to plan, we the test should be green.
Next Steps
These were just a few glimpses about how to migrate all our Postman tests to JMeter, to automatize our API’s processes and use cases. Of course, JMeter offers us a lot of possibilities to sink our teeth into in order to improve our test suite and, consequently, our REST server.
JMeter gives us multithreading tools to do stress testing on our server and be able to visualize response times, searching potential timeouts, memory leaks or stack overflows in case we’re working with microservices that communicate in an asynchronous manner. All the response time data is gathered by the application and can be visualized in the form of graphics so we can determine our API’s acceptable response time limits.
The post Automatizing a Postman test with JMeter appeared first on Apiumhub.


