Here is a very short demo to show "Follower Reads" feature
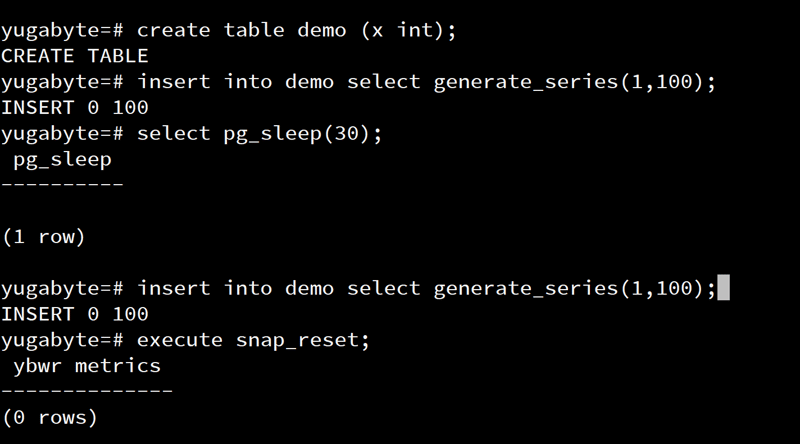
I install my ybwr.sql to display tablet server statistics and create a demo table where I insert two times 100 rows at 30 second interval:
\! curl -s https://raw.githubusercontent.com/FranckPachot/ybdemo/main/docker/yb-lab/client/ybwr.sql | grep -v '\watch' > ybwr.sql
\i ybwr.sql
create table demo (x int);
insert into demo select generate_series(1,100);
select pg_sleep(30);
insert into demo select generate_series(1,100);
execute snap_reset;
I query all rows and display the tablet statistics:
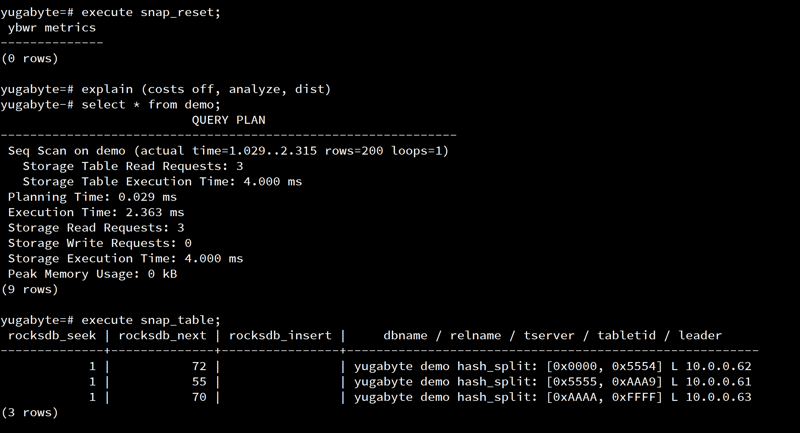
execute snap_reset;
explain (costs off, analyze, dist)
select * from demo;
execute snap_table;
It has read rows=200 from 3 tablets (ranges [0x0000, 0x5554], [0x5555, 0xAAA9], [0xAAAA, 0xFFFF]) from 3 tablet servers (10.0.0.62, 10.0.0.61, 10.0.0.63) leader (L) tablet peer:

I'm using packed rows (--ysql_enable_packed_row=true), so 200 RocksDB entries, which is a seek() to the beginning of each tablets (rocksdb_seek=1+1+1) reading 3 rows and the next() 72+55+70 197 rows to get the total of 100 rows.
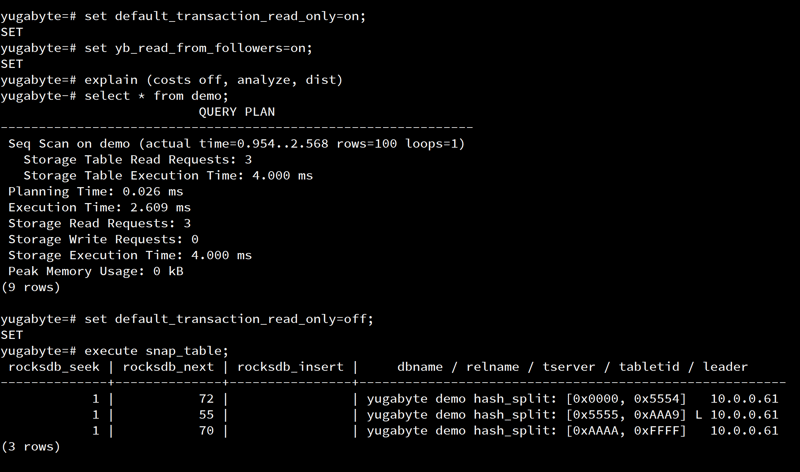
Now in a read-only transaction with follower reads enabled:
execute snap_table;
set default_transaction_read_only=on;
set yb_read_from_followers=on;
explain (costs off, analyze, dist)
select * from demo;
set default_transaction_read_only=off;
execute snap_table;
Only 100 rows are read because the default staleness is 30 seconds (yb_follower_read_staleness_ms=30000) and only 100 rows were inserted before:

The only difference in the execution plan is rows=100 without any indication of follower reads. Even the time is similar here because I have 3 nodes on the same VM in this lab. However, the statistics show the same numbers (because all replicas hold the same rows) but from one server only (10.0.0.61) and only one leader (L). The others were the followers which were preferred to remote nodes (my connection is on 10.0.0.61) when followers can provide the consistent view from 30 seconds before.


