<!DOCTYPE html>
Top 15 Statistical Methods in Data Science: A Complete Guide with Examples
<br> body {<br> font-family: Arial, sans-serif;<br> }</p> <div class="highlight"><pre class="highlight plaintext"><code> h1, h2, h3 { text-align: center; } img { display: block; margin: 20px auto; max-width: 80%; } code { background-color: #f0f0f0; padding: 5px; border-radius: 3px; font-family: monospace; } </code></pre></div> <p>
Top 15 Statistical Methods in Data Science: A Complete Guide with Examples
Introduction
Data science has revolutionized the way we understand and interact with the world around us. At its core lies the power of statistical methods, which enable us to extract meaningful insights from raw data. This article delves into the top 15 statistical methods commonly employed in data science, providing a comprehensive understanding of their applications, techniques, and practical examples.
Essential Statistical Methods in Data Science
Here are 15 fundamental statistical methods used in data science, categorized for ease of understanding:
- Descriptive Statistics
Descriptive statistics form the bedrock of data analysis. They provide a concise summary of the key features of a dataset, allowing us to grasp its overall characteristics.
-
Mean: The average value of a dataset. It represents the central tendency of the data.

- Median: The middle value in a sorted dataset. It is less affected by outliers than the mean.
- Mode: The most frequent value in a dataset. It indicates the most common observation.
-
Standard Deviation: A measure of the spread or dispersion of data points around the mean.

- Variance: The square of the standard deviation, measuring the average squared deviation from the mean.
- Range: The difference between the maximum and minimum values in a dataset.
- Percentiles: Values that divide a dataset into 100 equal parts. For example, the 25th percentile represents the value below which 25% of the data lies.
Probability and distributions are essential for modeling and understanding the likelihood of events and the variability in data.
- Probability: The likelihood of a specific event occurring. It is expressed as a number between 0 and 1, where 0 indicates impossibility and 1 indicates certainty.
-
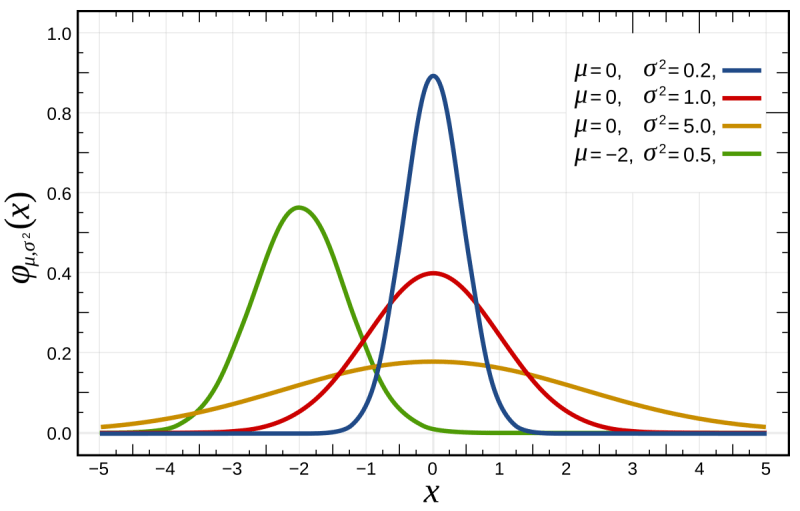
Probability Distributions: Mathematical functions that describe the probability of different outcomes in a random experiment. Common distributions include:
-
Normal Distribution: A bell-shaped distribution commonly used to model many natural phenomena.
- Binomial Distribution: A discrete distribution used to model the probability of a specific number of successes in a fixed number of trials.
- Poisson Distribution: A discrete distribution that models the probability of a certain number of events occurring in a fixed interval of time or space.
-
Normal Distribution: A bell-shaped distribution commonly used to model many natural phenomena.
- Central Limit Theorem: A fundamental theorem stating that the distribution of sample means approaches a normal distribution as the sample size increases.
Hypothesis testing allows us to draw inferences about populations based on sample data. It involves formulating hypotheses about the population and testing them using statistical methods.
- Null Hypothesis: A statement about the population parameter that we aim to disprove.
- Alternative Hypothesis: A statement that contradicts the null hypothesis.
- Test Statistic: A value calculated from the sample data that measures the evidence against the null hypothesis.
- P-value: The probability of observing the test statistic or a more extreme value, assuming the null hypothesis is true. A low p-value (typically less than 0.05) suggests evidence against the null hypothesis.
-
Types of Tests:
- t-test: Used to compare the means of two groups.
- Z-test: Used to compare the means of two large samples.
- Chi-square test: Used to analyze categorical data and test relationships between variables.
- ANOVA: Used to compare the means of more than two groups.
Regression analysis is a statistical technique used to model the relationship between a dependent variable and one or more independent variables. It helps us understand how changes in the independent variables affect the dependent variable.
-
Simple Linear Regression: A model that uses one independent variable to predict a dependent variable.

- Multiple Linear Regression: A model that uses multiple independent variables to predict a dependent variable.
- Logistic Regression: A model used for predicting categorical dependent variables, such as binary outcomes (e.g., yes/no, true/false).
- Polynomial Regression: A model that uses polynomial terms of independent variables to capture non-linear relationships.
Correlation analysis quantifies the strength and direction of the linear relationship between two variables. It helps us understand how changes in one variable are associated with changes in another.
-
Correlation Coefficient (r): A statistical measure that ranges from -1 to +1. A correlation coefficient of +1 indicates a perfect positive linear relationship, -1 indicates a perfect negative linear relationship, and 0 indicates no linear relationship.

- Spearman's Rank Correlation: A non-parametric method used to measure the monotonic relationship between two variables, regardless of whether the relationship is linear.
Time series analysis deals with data collected over time, often exhibiting patterns, trends, and seasonality. It is essential for forecasting future values and understanding the dynamics of temporal data.
- Trend: A long-term pattern in the data, such as an upward or downward trend.
- Seasonality: A repeating pattern that occurs at regular intervals, such as daily, weekly, or yearly fluctuations.
- Autocorrelation: The correlation of a time series with itself at different lags. It helps identify patterns and dependencies over time.
- Moving Averages: Techniques used to smooth out fluctuations in time series data and identify trends.
- ARIMA (Autoregressive Integrated Moving Average): A powerful forecasting model that captures the autoregressive, integrated, and moving average components of a time series.
Cluster analysis is an unsupervised learning technique that aims to group similar data points together based on their characteristics. It helps us discover hidden patterns and structures in data.
-
K-means Clustering: An algorithm that partitions data points into k clusters, minimizing the sum of squared distances from each point to its cluster centroid.

- Hierarchical Clustering: An algorithm that creates a hierarchy of clusters, starting with individual data points and merging them into larger clusters based on their similarity.
- DBSCAN (Density-Based Spatial Clustering of Applications with Noise): An algorithm that identifies clusters based on the density of data points, separating dense regions from sparse regions.
Dimensionality reduction techniques are used to reduce the number of variables in a dataset without losing significant information. This can improve model performance, simplify analysis, and facilitate visualization.
-
Principal Component Analysis (PCA): A technique that transforms a dataset into a set of orthogonal principal components, capturing the most variance in the data.

- Linear Discriminant Analysis (LDA): A supervised technique that aims to find linear combinations of features that best separate different classes.
- t-Distributed Stochastic Neighbor Embedding (t-SNE): A non-linear dimensionality reduction technique that maps high-dimensional data to a low-dimensional space while preserving local neighborhoods.
Bayesian statistics provides a framework for updating beliefs about a phenomenon based on new evidence. It is particularly useful in situations where prior knowledge is available or when dealing with uncertainty.
- Prior Distribution: A probability distribution that represents our prior knowledge about a parameter before observing any data.
- Likelihood Function: A function that describes the probability of observing the data given a specific value of the parameter.
- Posterior Distribution: A probability distribution that represents our updated belief about the parameter after observing the data.
- Bayes' Theorem: A mathematical formula that relates the prior, likelihood, and posterior distributions.
Statistical sampling is a technique used to collect data from a subset of a population to make inferences about the entire population. It is essential when analyzing large datasets or when collecting data is expensive or time-consuming.
- Simple Random Sampling: Each member of the population has an equal chance of being selected for the sample.
- Stratified Sampling: The population is divided into subgroups, and a random sample is drawn from each subgroup.
- Cluster Sampling: The population is divided into clusters, and a random sample of clusters is selected.
Bootstrapping is a resampling technique that allows us to estimate the sampling distribution of a statistic by repeatedly drawing samples with replacement from the original data.
- Resampling: Drawing multiple samples with replacement from the original data.
- Confidence Intervals: Using the bootstrap distribution to estimate confidence intervals for population parameters.
- Hypothesis Testing: Using the bootstrap distribution to test hypotheses about population parameters.
Statistical power is the probability of correctly rejecting a false null hypothesis. It measures the sensitivity of a statistical test to detect real differences or effects.
- Type I Error: Rejecting the null hypothesis when it is actually true.
- Type II Error: Failing to reject the null hypothesis when it is actually false.
- Power: The probability of correctly rejecting a false null hypothesis.
DOE is a systematic approach to planning and conducting experiments to optimize processes and products. It involves designing experiments to minimize variability and maximize the information gained.
- Factorial Design: An experimental design that considers multiple factors and their interactions.
- Response Surface Methodology (RSM): A technique used to optimize a response variable by fitting a model to the relationship between the response and the factors.
Survival analysis deals with time-to-event data, such as the time until a patient dies or the time until a machine fails. It helps us understand the factors that influence the duration of events.
- Kaplan-Meier Estimator: A method used to estimate the survival function, which represents the probability of surviving beyond a certain time.
- Cox Proportional Hazards Model: A regression model used to analyze the effects of covariates on the hazard function, which represents the instantaneous risk of an event.
Machine learning algorithms leverage statistical methods to learn from data and make predictions. These algorithms can be broadly classified into supervised, unsupervised, and reinforcement learning.
-
Supervised Learning: Algorithms that learn from labeled data to make predictions on new, unseen data.
- Linear Regression: Predicting continuous outcomes.
- Logistic Regression: Predicting categorical outcomes.
- Support Vector Machines (SVMs): Classifying data into different categories.
- Decision Trees: Building tree-like structures to classify data.
- Random Forests: Combining multiple decision trees to improve accuracy.
-
Unsupervised Learning: Algorithms that learn from unlabeled data to discover patterns and structures.
- K-means Clustering: Grouping similar data points together.
- Principal Component Analysis (PCA): Reducing the dimensionality of data.
- Reinforcement Learning: Algorithms that learn by interacting with an environment and receiving rewards or punishments for their actions.
Conclusion
Statistical methods are the backbone of data science, providing the tools and techniques necessary to extract valuable insights from data. The 15 methods discussed in this article represent a diverse range of approaches, from descriptive statistics to machine learning, covering a wide spectrum of data analysis tasks. By mastering these methods, data scientists can effectively explore, analyze, and model data to drive informed decision-making and unlock the transformative power of data.


